Asked by DANIEL RAMOS on Apr 24, 2024

Verified
MNM, Inc.has three stores located in three different areas.Random samples of the daily sales of the three stores (in $1000) are shown below. 
At the 1% level of significance, test to see if there is a significant difference in the average sales of the three stores.Use both the critical and p-value approaches.
Level of Significance
A threshold within statistical hypothesis testing that measures the degree of certainty or the probability level below which the null hypothesis is rejected.
Daily Sales
Daily sales represent the total amount of products or services sold by a business during one day.
Critical Value
A threshold value that is compared with the test statistic to determine whether to reject the null hypothesis in hypothesis testing.
- Adopt the understanding and practical approach of Analysis of Variance (ANOVA) in assessing variations among group means.
- Undertake hypothesis testing by integrating both critical value and p-value processes.

Verified Answer
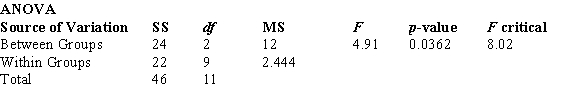
F = 4.91 < 8.02; p-value is between .025 and .05; fail to reject H0.

Learning Objectives
- Adopt the understanding and practical approach of Analysis of Variance (ANOVA) in assessing variations among group means.
- Undertake hypothesis testing by integrating both critical value and p-value processes.
Related questions
Random Samples of Employees from Three Different Departments of MNM ...
For Four Populations, the Population Variances Are Assumed to Be ...
{GMAT Scores Narrative} Set Up the ANOVA Table ...
{Arthritis Pain Formulas Narrative} Do These Data Provide Sufficient Evidence ...
A Random Sample of N = 36 Observations from a ...