Asked by Lucas Garcia on Apr 26, 2024

Verified
In the table below are selected values for the OC curve associated with the acceptance sampling plan n = 50, c = 1. (Watch out-the points are not evenly spaced.) Assume that upon failed inspection, defective items are replaced. Calculate the AOQ for each data point. (You may assume that the population is much larger than the sample.) Plot the AOQ curve. At approximately what population defective rate is the AOQ at its worst? Explain how this happens. How well does this plan meet the specifications of AQL = 0.0050, α = 0.05; LTPD = 0.05, β = 0.10? Discuss.
Population percent defective Probability of acceptance 0.0050.973870.010.910560.020.735770.030.555280.040.400480.050.279430.060.190000.080.08271\begin{array} { | c | c | } \hline \begin{array} { c } \text { Population percent } \\\text { defective }\end{array} & \begin{array} { c } \text { Probability of } \\\text { acceptance }\end{array} \\\hline 0.005 & 0.97387 \\\hline 0.01 & 0.91056 \\\hline 0.02 & 0.73577 \\\hline 0.03 & 0.55528 \\\hline 0.04 & 0.40048 \\\hline 0.05 & 0.27943 \\\hline 0.06 & 0.19000 \\\hline 0.08 & 0.08271 \\\hline\end{array} Population percent defective 0.0050.010.020.030.040.050.060.08 Probability of acceptance 0.973870.910560.735770.555280.400480.279430.190000.08271
OC Curve
Operating Characteristic Curve; it's a graphical representation used in statistical quality control to show the probability of accepting lots or batches of items based on their quality.
AOQ Curve
A graphical representation depicting how the Average Outgoing Quality changes in relation to the fraction of products inspected or the effectiveness of the screening process.
Population Defective Rate
A measure in quality control that indicates the percentage of items in a population that are considered to be defective.
- Comprehend the concept of acceptance sampling and its utility in managing quality.
- Compute and examine the Average Outgoing Quality (AOQ) within acceptance sampling protocols.

Verified Answer
JL
Jailene LaureanoMay 02, 2024
Final Answer :
This plan does not meet the specification very well. At .005 defective, the probability of acceptance is not 95% but over 97. At 0.05 defective, the acceptance rate is not 5% but 28. 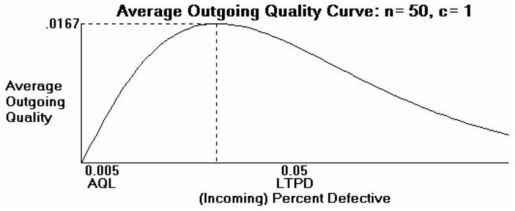 Population percent defective Probability of acceptance AOQ 0.0050.973870.004869 at AQL 0.010.910560.0091060.020.735770.0147150.030.555280.016658 maximum 0.040.400480.0160190.050.279430.013972 at LTPD 0.060.190000.01140.080.082710.006617\begin{array} { | c | c | c | c | } \hline \begin{array} { c } \text { Population } \\\text { percent } \\\text { defective }\end{array} & \begin{array} { c } \text { Probability of } \\\text { acceptance }\end{array} & \text { AOQ } & \\\hline 0.005 & 0.97387 & 0.004869 & \text { at AQL } \\\hline 0.01 & 0.91056 & 0.009106 & \\\hline 0.02 & 0.73577 & 0.014715 & \\\hline 0.03 & 0.55528 & 0.016658 & \text { maximum } \\\hline 0.04 & 0.40048 & 0.016019 & \\\hline 0.05 & 0.27943 & 0.013972 & \text { at LTPD } \\\hline 0.06 & 0.19000 & 0.0114 & \\\hline 0.08 & 0.08271 & 0.006617 & \\\hline\end{array} Population percent defective 0.0050.010.020.030.040.050.060.08 Probability of acceptance 0.973870.910560.735770.555280.400480.279430.190000.08271 AOQ 0.0048690.0091060.0147150.0166580.0160190.0139720.01140.006617 at AQL maximum at LTPD
Population percent defective Probability of acceptance AOQ 0.0050.973870.004869 at AQL 0.010.910560.0091060.020.735770.0147150.030.555280.016658 maximum 0.040.400480.0160190.050.279430.013972 at LTPD 0.060.190000.01140.080.082710.006617\begin{array} { | c | c | c | c | } \hline \begin{array} { c } \text { Population } \\\text { percent } \\\text { defective }\end{array} & \begin{array} { c } \text { Probability of } \\\text { acceptance }\end{array} & \text { AOQ } & \\\hline 0.005 & 0.97387 & 0.004869 & \text { at AQL } \\\hline 0.01 & 0.91056 & 0.009106 & \\\hline 0.02 & 0.73577 & 0.014715 & \\\hline 0.03 & 0.55528 & 0.016658 & \text { maximum } \\\hline 0.04 & 0.40048 & 0.016019 & \\\hline 0.05 & 0.27943 & 0.013972 & \text { at LTPD } \\\hline 0.06 & 0.19000 & 0.0114 & \\\hline 0.08 & 0.08271 & 0.006617 & \\\hline\end{array} Population percent defective 0.0050.010.020.030.040.050.060.08 Probability of acceptance 0.973870.910560.735770.555280.400480.279430.190000.08271 AOQ 0.0048690.0091060.0147150.0166580.0160190.0139720.01140.006617 at AQL maximum at LTPD 
Learning Objectives
- Comprehend the concept of acceptance sampling and its utility in managing quality.
- Compute and examine the Average Outgoing Quality (AOQ) within acceptance sampling protocols.