Asked by Griffin Skubish on Apr 28, 2024

Verified
A part that connects two levels should have a distance between the two holes of 4". It has been determined that x-bar and R-charts should be set up to determine if the process is in statistical control. The following ten samples of size four were collected. Calculate the control limits, plot the control charts, and determine if the process is in control.
Mean Range Sample 1 4.010.04 Sample 2 3.980.06 Sample 3 4.000.02 Sample 4 3.990.05 Sample 5 4.030.06 Sample 6 3.970.02 Sample 7 4.020.02 Sample 8 3.990.04 Sample 9 3.980.05 Sample 10 4.010.06\begin{array} { | l | l | l | } \hline & \text { Mean } & \text { Range } \\\hline \text { Sample 1 } & 4.01 & 0.04 \\\hline \text { Sample 2 } & 3.98 & 0.06 \\\hline \text { Sample 3 } & 4.00 & 0.02 \\\hline \text { Sample 4 } & 3.99 & 0.05 \\\hline \text { Sample 5 } & 4.03 & 0.06 \\\hline \text { Sample 6 } & 3.97 & 0.02 \\\hline \text { Sample 7 } & 4.02 & 0.02 \\\hline \text { Sample 8 } & 3.99 & 0.04 \\\hline \text { Sample 9 } & 3.98 & 0.05 \\\hline \text { Sample 10 } & 4.01 & 0.06 \\\hline\end{array} Sample 1 Sample 2 Sample 3 Sample 4 Sample 5 Sample 6 Sample 7 Sample 8 Sample 9 Sample 10 Mean 4.013.984.003.994.033.974.023.993.984.01 Range 0.040.060.020.050.060.020.020.040.050.06
Statistical Control
A methodology within statistical process control that uses statistical techniques to monitor and control a process, ensuring it operates at its full potential.
X-bar
A symbol representing the mean of a sample in statistical processes, commonly used in control charts to monitor process performance.
R-charts
Control charts used to monitor the range within a sample, helping to identify variability in a process over time.
- Acquire knowledge about the core concepts of statistical process control (SPC) and its critical role in quality assurance.
- Pursue the calculation and elucidation of control limits and process capabilities across a range of control chart types including X-bar, R-chart, p-chart, and c-chart.
- Explore sample data to see if a process is under the influence of statistical control.

Verified Answer
JR
Jenny RabangApr 29, 2024
Final Answer :
X-bar Range X-doublebar value 3.998 R bar 0.042 Upper control limit 4.0290.096 Center line 3.9980.042 Lower control limit 3.9670\begin{array} { | l | l | l | } \hline & \text { X-bar } & \text { Range } \\\hline \text { X-doublebar value } & 3.998 & \\\hline \text { R bar } & 0.042 & \\\hline \text { Upper control limit } & 4.029 & 0.096 \\\hline \text { Center line } & 3.998 & 0.042 \\\hline \text { Lower control limit } & 3.967 & 0 \\\hline\end{array} X-doublebar value R bar Upper control limit Center line Lower control limit X-bar 3.9980.0424.0293.9983.967 Range 0.0960.0420 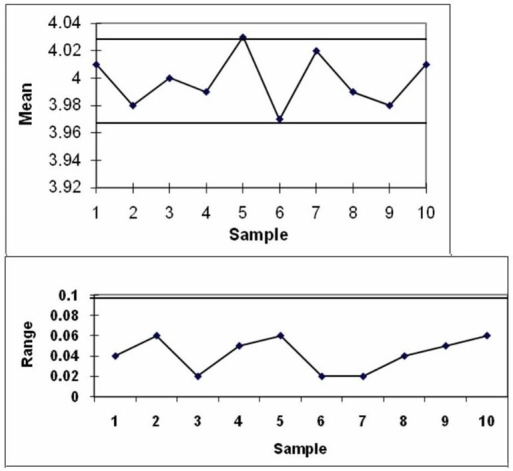 The process is out of control because of sample 5 on the x-bar chart.
The process is out of control because of sample 5 on the x-bar chart. 
Learning Objectives
- Acquire knowledge about the core concepts of statistical process control (SPC) and its critical role in quality assurance.
- Pursue the calculation and elucidation of control limits and process capabilities across a range of control chart types including X-bar, R-chart, p-chart, and c-chart.
- Explore sample data to see if a process is under the influence of statistical control.