Asked by J'Ona Wells on May 11, 2024

Verified
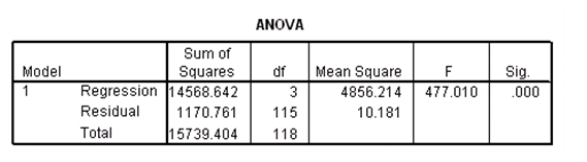
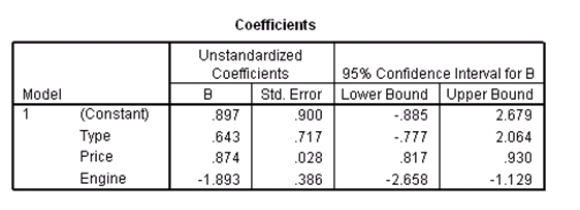
Researchers at a car resale company are trying to build a model to predict a car's 4-year resale value (in thousands of dollars)from several predictor variables.The variables they selected are as below. 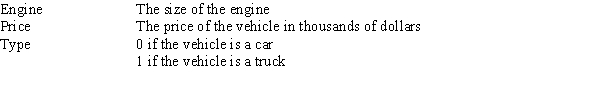 Data were collected on cars of different models made by different manufacturers.SPSS output for the least-squares regression model is given below.
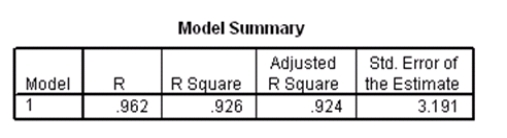
 A Normal quantile plot of the residuals is given below.
 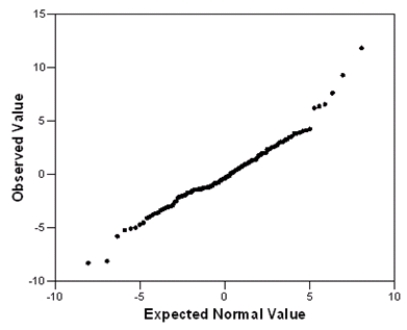 What assumption do we check with this graph,and does the assumption seem to be satisfied?
Normal Quantile Plot
A graphical method for assessing whether or not a data set is approximately normally distributed.
Residuals
The differences between observed values and the values predicted by a model, used in regression analysis to assess the fit of the model.
Regression Model
A statistical model used to understand the relationship between one dependent variable and one or more independent variables.
- Cultivate the competence to assess the accuracy of regression models critically.
- Acquire knowledge about residuals and their function within regression analysis.

Verified Answer

Learning Objectives
- Cultivate the competence to assess the accuracy of regression models critically.
- Acquire knowledge about residuals and their function within regression analysis.
Related questions
Based on a Sample of the Salaries of Professors at ...
The Difference Between the Observed Value of the Dependent Variable ...
The Normal Probability Plot Is a Graph That Plots the ...
If You Take the Residuals,subtract Their Mean and Divide by ...
{Telemarketer Sales and Experience Narrative} Use the Predicted and Actual ...