Asked by Lucas Garcia on May 26, 2024

Verified
An actuary wanted to develop a model to predict how long individuals will live. After consulting a number of physicians, she collected the age at death (y), the average number of hours of exercise per week (x1), the cholesterol level (x2), and the number of points that the individual's blood pressure exceeded the recommended value (x3). A random sample of 40 individuals was selected. The computer output of the multiple regression model is shown below. 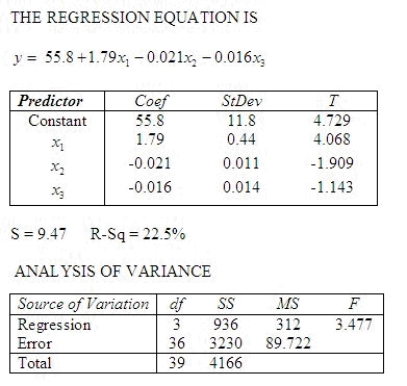 Is there enough evidence at the 10% significance level to infer that the model is useful in predicting length of life?
______________ enough evidence at the 10% significance level to infer that the model is useful in predicting length of life.
Is there enough evidence at the 1% significance level to infer that the average number of hours of exercise per week and the age at death are linearly related?
What is the test statistic?
t = ______________
Conclude:
______________  .
.
There ______________ enough evidence at the 1% significance level to infer that the average number of hours of exercise per week and the age at death are linearly related.
Is there enough evidence at the 5% significance level to infer that the cholesterol level and the age at death are negatively linearly related?
What is the test statistic?
t = ______________
Conclude:
______________  .
.
There ______________ enough evidence at the 5% significance level to infer that the cholesterol level and the age at death are negatively linearly related.
Is there sufficient evidence at the 5% significance level to infer that the number of points that the individual's blood pressure exceeded the recommended value and the age at death are negatively linearly related?
What is the test statistic?
t = ______________
Conclude:
______________  .
.
There ______________ sufficient evidence at the 5% significance level to infer that the number of points that the individual's blood pressure exceeded the recommended value and the age at death are negatively linearly related.
What is the coefficient of determination?  ______________
Explain:
________________________________________________________
Cholesterol Level
A measurement of the amount of cholesterol in the bloodstream, important for assessing cardiovascular health.
Significance Level
The point at which the null hypothesis is considered refuted in statistical analysis, typically represented by the symbol alpha.
Linearly Related
A relationship between two variables where the change in one variable is proportional to the change in another, represented graphically by a straight line.
- Utilize multiple regression models for solving real-world issues across different disciplines.
- Investigate the adequacy of regression models through statistical scrutiny.
- Analyze the impact of regression coefficients in multiple regression analysis.

Verified Answer

Learning Objectives
- Utilize multiple regression models for solving real-world issues across different disciplines.
- Investigate the adequacy of regression models through statistical scrutiny.
- Analyze the impact of regression coefficients in multiple regression analysis.
Related questions
In a Multiple Regression Analysis Involving 40 Observations and 5 ...
If All the Points for a Multiple Regression Model with ...
{Student's Final Grade Narrative} Does This Data Provide Enough Evidence ...
{Student's Final Grade Narrative} Interpret the Coefficient B 3
Regression Analysis Was Applied Between Sales Data (Y in $1000s) ...