Asked by Carmen Ortega on Jun 02, 2024

Verified
A textile company is interested in knowing if there is a difference in the breaking strength of four different kinds of thread. 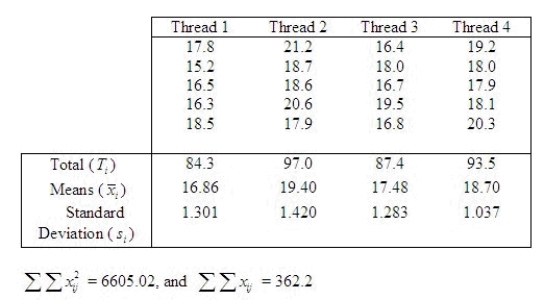 Test whether there is a significant difference in mean breaking strength of the four kinds of thread. Calculate the test statistic.
F = ______________
Set up the rejection region for  = 0.05.
The rejection region is ______________.
What conclusion can be drawn?
______________
______________ of the mean breaking strengths of the four kinds of threads is significantly different from the others.
Find the approximate p-value.
CI = ______________ Enter (n1, n2)
Find a 90% confidence interval for  .
.
CI = ______________ Enter (n1, n2)
Breaking Strength
The maximum amount of stress or force a material can withstand before it breaks or fails.
Mean Breaking Strength
The average force required to break a material or object under tension tests.
Test Statistic
A numerical value computed from sample data to evaluate a hypothesis in statistical analysis.
- Calculate the F-test statistic and examine its corresponding p-value in one-way ANOVA analysis.
- Clarify the notion of rejection region and the method for determining the rejection of the null hypothesis in one-way ANOVA.
- Delve into the repercussions of significant and non-significant results within one-way ANOVA.

Verified Answer
AD
Aleyssa De JesusJun 08, 2024
Final Answer :
4.118; 3.24; Reject the null hypothesis; At least one; (0.010, 0.025); (-2.02, 0.78)

Learning Objectives
- Calculate the F-test statistic and examine its corresponding p-value in one-way ANOVA analysis.
- Clarify the notion of rejection region and the method for determining the rejection of the null hypothesis in one-way ANOVA.
- Delve into the repercussions of significant and non-significant results within one-way ANOVA.
Related questions
Water Samples Were Taken at Four Different Locations in a ...
An Insurance Company Is Considering Opening a New Branch in ...
The Following Statistics Were Calculated Based on Samples Drawn from ...
In ANOVA,the F-Test Is the Ratio of Two Sample Variances ...
The Following Data Shows Annual Income,in Thousands of Dollars,categorized According ...