Asked by Braeden Moody on Jun 06, 2024

Verified
The histogram below shows data from 30 students who were asked,"How much time do you spend on the Internet in minutes?" What are some features about the data? 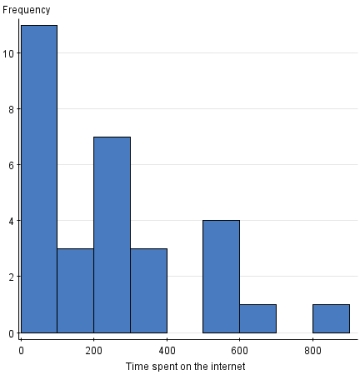
A) There is a potential outlier.
B) Most values are around 800.
C) The range of values is between 0 and 400.
D) None of the above
Potential Outlier
An observation in a dataset that is significantly different from the rest, possibly indicating an error or a unique case.
Histogram
A graphical representation of data using bars of different heights where each bar groups numbers into ranges.
- Understand and apply the concepts of histograms, including the significance of class size.

Verified Answer
FS
felicia shreevesJun 11, 2024
Final Answer :
A
Explanation :
There is a potential outlier shown in the histogram, as there is one bar that extends much higher than the others, indicating that there may be one or a few students who spend significantly more time on the Internet than the rest of the group. The other statements, that most values are around 800 and that the range is between 0 and 400, are not supported by the histogram.

Learning Objectives
- Understand and apply the concepts of histograms, including the significance of class size.