Asked by Simon Sazian on Jun 21, 2024

Verified
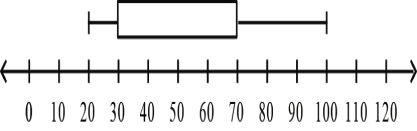
In the box-and-whisker plot below,50% of the data is between 30 and 70.
Box-And-Whisker Plot
Also called a boxplot; a type of graph that shows all four quartiles and the least number; it is drawn to scale.
- Evaluate statistical evidence on auto maintenance and the financial aspects of vehicle ownership.

Verified Answer
AC
aimee casasJun 22, 2024
Final Answer :
True
Explanation :
In a box-and-whisker plot, the box represents the middle 50% of the data. If 50% of the data is between 30 and 70, then it must be contained within the box, so this statement is true.

Learning Objectives
- Evaluate statistical evidence on auto maintenance and the financial aspects of vehicle ownership.