Asked by William Loughran on Jun 29, 2024

Verified
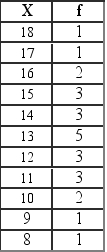
Refer to Exhibit 6-1. Create a frequency distribution from the set of scores.
Frequency Distribution
An overview of all distinct values in some variable and the number of times they occur.
- Build competence in formulating and deciphering frequency distributions, histograms, and ogive curves.

Verified Answer
SP

Learning Objectives
- Build competence in formulating and deciphering frequency distributions, histograms, and ogive curves.
Related questions
Using the Numbers in Exhibit 6-1, Draw a Frequency Distribution ...
A Histogram Is the Preferred Method Over the Cumulative Distribution ...
Histograms and Frequency Polygons Are Visual Representations of Frequency Distributions
Refer to Exhibit 6-2. Draw a Frequency Distribution
A Histogram Conveys the Same Information That a Frequency Polygon ...