Asked by Marissa Gonçalves on Jul 03, 2024

Verified
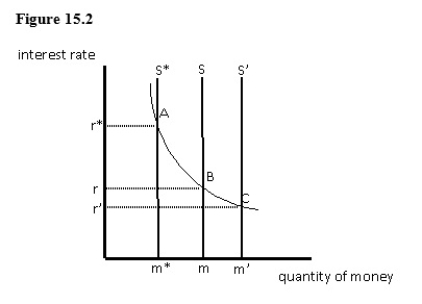
The figure given below shows equilibrium in a money market.Which of the following will be observed if the money supply curve shifts from S to S' while the rate of interest remains at "r"?

A) There will be an excess demand for money.
B) There will be an excess supply of money.
C) The Fed will buy U.S.Treasury securities.
D) The quantity of money demanded will fall.
E) The quantity of money supplied will fall.
Money Supply Curve
A graphical representation of the relationship between the money supply and the interest rate in an economy.
Excess Supply
A situation where the quantity of a good or service supplied is more than the quantity demanded at the current price.
Interest Rate
The amount charged, expressed as a percentage of principal, by a lender to a borrower for the use of assets over a specific period of time.
- Understand the dynamics between money supply, demand for it, and the prevailing interest rates in the money market.
- Interpret graphical representations of the money market and monetary policy actions.

Verified Answer
AC
Argenis ColonJul 08, 2024
Final Answer :
B
Explanation :
The equilibrium interest rate is determined at the intersection of the money supply and money demand curves. If the money supply curve shifts to the right (from S to S'), there will be an excess supply of money at the original interest rate. This will put downward pressure on the interest rate, causing it to fall until a new equilibrium is reached.

Learning Objectives
- Understand the dynamics between money supply, demand for it, and the prevailing interest rates in the money market.
- Interpret graphical representations of the money market and monetary policy actions.