Asked by eliana mezzenga on Sep 22, 2024

Verified
A professor examines the relationship between minutes studying and exam score (out of 200 points)for a random sample of his students.The scatter diagram is shown below.It appears that study time has somewhat of a positive linear relationship with exam score. 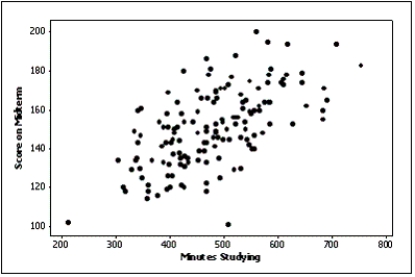
Positive Linear Relationship
A direct correlation between two variables in which they both increase or decrease together at a constant rate, as depicted by a positively sloped line on a graph.
Scatter Diagram
A graphical representation of the relationship between two quantitative variables, showing how one variable is affected by changes in the other variable.
- Master the understanding of linear relationships as demonstrated in scatter diagrams.
- Identify characteristics of data represented in scatter diagrams including the strength and direction of a relationship.

Verified Answer

Learning Objectives
- Master the understanding of linear relationships as demonstrated in scatter diagrams.
- Identify characteristics of data represented in scatter diagrams including the strength and direction of a relationship.
Related questions
The Graphical Technique Used to Describe the Relationship Between Two ...
How Do You Determine Whether Two Interval Variables Have a ...
The Two Most Important Characteristics Revealed by the Scatter Diagram ...
In Order to Draw a Scatter Diagram,we Need Interval Data ...
Which of the Following Is the Method Statisticians Use to ...