Asked by Bentou Sanoe on Jun 13, 2024

Verified
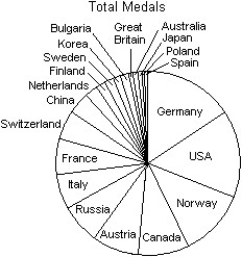
A prediction of the number of medals to be won by various countries in the 2014 Winter Olympics was made using past Olympics data.The predicted values are listed in the table below. Country Medals Germany 37 USA 36 Norway 27 Canada 24 Austria 16 Russia 16 Italy 15 France 15 Switzerland 13 China 10\begin{array} { l | c } \text { Country } & \text { Medals } \\\hline \text { Germany } & 37 \\\text { USA } & 36 \\\text { Norway } & 27 \\\text { Canada } & 24 \\\text { Austria } & 16 \\\text { Russia } & 16 \\\text { Italy } & 15 \\\text { France } & 15 \\\text { Switzerland } & 13 \\\text { China } & 10\end{array} Country Germany USA Norway Canada Austria Russia Italy France Switzerland China Medals 37362724161615151310 Country Medals Netherlands 5 Finland 4 Sweden 4 Korea 3 Bulgaria 3 Great Britain 2 Australia 2 Japan 2 Poland 1 Spain 1\begin{array} { l | c } \text { Country } & \text { Medals } \\\hline \text { Netherlands } & 5 \\\text { Finland } & 4 \\\text { Sweden } & 4 \\\text { Korea } & 3 \\\text { Bulgaria } & 3 \\\text { Great Britain } & 2 \\\text { Australia } & 2 \\\text { Japan } & 2 \\\text { Poland } & 1 \\\text { Spain } & 1\end{array} Country Netherlands Finland Sweden Korea Bulgaria Great Britain Australia Japan Poland Spain Medals 5443322211 Which of the following displays is the most appropriate for these data?
I 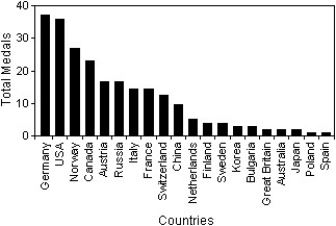
II 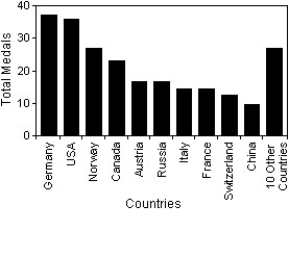
III
A) I
B) III
C) II
D) All of these displays are equally appropriate.
E) None of these displays are appropriate.
Winter Olympics
A multi-sport event held every four years, featuring winter sports competitions where athletes from various countries participate.
Predicted Values
The outcomes estimated by a statistical model, based on certain input variables.
Medals
Awards given for achieving a high level of performance in a particular event, often used in the context of sports or competitions.
- Ascertain the proper and improper visual displays for particular data.

Verified Answer
KG
Kanika GroverJun 15, 2024
Final Answer :
C
Explanation :
The most appropriate display for these data is a horizontal bar graph which is shown in display II. This is because the predicted values are categorical (countries) and the data is numerical (number of medals), making a bar graph the most appropriate choice. Display I is inappropriate because it shows data points on a two-dimensional scatterplot, which is not appropriate for this type of data. Display III is also inappropriate because it is a line graph, which is not appropriate for categorical data.

Learning Objectives
- Ascertain the proper and improper visual displays for particular data.