Asked by eliana mezzenga on Sep 22, 2024
A professor examines the relationship between minutes studying and exam score (out of 200 points)for a random sample of his students.The scatter diagram is shown below.It appears that study time has somewhat of a positive linear relationship with exam score. 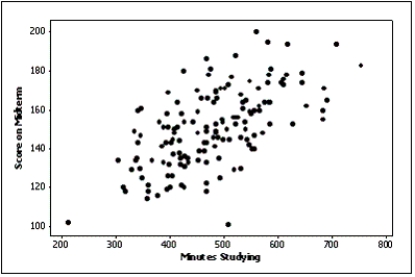
Positive Linear Relationship
A direct correlation between two variables in which they both increase or decrease together at a constant rate, as depicted by a positively sloped line on a graph.
Scatter Diagram
A graphical representation of the relationship between two quantitative variables, showing how one variable is affected by changes in the other variable.
- Master the understanding of linear relationships as demonstrated in scatter diagrams.
- Identify characteristics of data represented in scatter diagrams including the strength and direction of a relationship.

Learning Objectives
- Master the understanding of linear relationships as demonstrated in scatter diagrams.
- Identify characteristics of data represented in scatter diagrams including the strength and direction of a relationship.
Related questions
How Do You Determine Whether Two Interval Variables Have a ...
In Order to Draw a Scatter Diagram,we Need Interval Data ...
The Two Most Important Characteristics Revealed by the Scatter Diagram ...
Which of the Following Is the Method Statisticians Use to ...
The Graphical Technique Used to Describe the Relationship Between Two ...