Asked by Brian Dykstra on Jul 03, 2024

Verified
A random sample of 7 observations was drawn from a normal population. The following summations were computed: 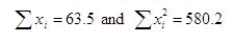 Test the hypotheses H0:
  = 8 vs. H1:
  > 8 at the 1% significance level.
Test statistic = ______________
Critical Value(s) = ______________
Conclusion: ______________
Interpretation: ______________
Normal Population
Refers to a population distribution that follows a bell-shaped curve, characterized by its symmetrical shape and where most observations cluster around the mean.
Significance Level
The probability of rejecting the null hypothesis in a statistical test when it is actually true, commonly denoted by alpha (α) and used as a threshold for determining statistical significance.
Test Statistic
The calculated value used to decide whether to reject the null hypothesis in hypothesis testing.
- Process and make sense of test statistics as well as p-values.
- Familiarize oneself with and apply the procedures of hypothesis testing to ascertain population means.
- Outline the variances between one-tailed and two-tailed tests in statistical analyses.

Verified Answer
WZ
WENXUAN ZHANGJul 10, 2024
Final Answer :
3.68; 3.143; Reject H0; The population mean is larger than 8

Learning Objectives
- Process and make sense of test statistics as well as p-values.
- Familiarize oneself with and apply the procedures of hypothesis testing to ascertain population means.
- Outline the variances between one-tailed and two-tailed tests in statistical analyses.