Asked by Kelsey Martin on Jul 13, 2024

Verified
A shop owner tries to predict heater sales by displaying the sales of hot chocolate and heaters on the following scatterplot.Does the scatterplot of hot chocolate sales and heater sales indicate that it is appropriate to calculate the correlation? 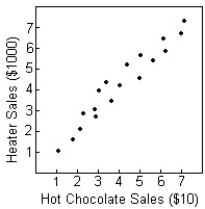
A) No: the relation must be linear.
B) Yes: the relation is strong.
C) Yes: the direction is positive.
D) Yes: the relation is linear.
E) Yes: the two variables are quantitative.
Scatterplot
A graph in which the values of two variables are plotted along two axes, the pattern of points revealing any correlations present.
Correlation
A numerical metric that illustrates the degree to which two variables move in tandem, demonstrating the intensity and orientation of their association.
Hot Chocolate
A warm beverage made from melted chocolate or cocoa powder mixed with milk or water and sugar.
- Grasp the importance of correlation in quantifying the strength and direction of relationships between variables.
- Recognize the limitations of correlations and the importance of considering linearity and quantitative variables.

Verified Answer

Learning Objectives
- Grasp the importance of correlation in quantifying the strength and direction of relationships between variables.
- Recognize the limitations of correlations and the importance of considering linearity and quantitative variables.
Related questions
Adam Would Like to Buy a Used Car,and Collected Several ...
A Reporter Investigates Speeding on Roads in a County and ...
A Survey Was Conducted in 20 Counties to Determine the ...
Which of the Following Represents the Weakest Correlation Between Two ...
Correlational Research Is Most Useful for Purposes of ...