Asked by Alysha Brown on Jul 20, 2024

Verified
A weight-loss company used the following histogram to show the distribution of the number of pounds lost by clients during the year 2014.Comment on the display. 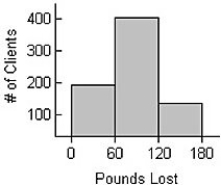
Histogram
A graphical representation of data using bars of different heights to show the frequency of values in intervals.
Weight-Loss
Refers to the reduction of the total body mass due to a mean loss of fluid, body fat, or lean mass.
Pounds Lost
Represents the amount of body weight, measured in pounds, that an individual has successfully reduced.
- Acquire knowledge on how to characterize and understand the contour of distributions within histograms.
- Acknowledge aberrations and their implications for data analysis.

Verified Answer
HW
Heather WeberJul 25, 2024
Final Answer :
Histogram bin widths are too wide to be useful.However,we can tell that about 200 clients lost between 0 and 60 pounds,400 clients lost between 60 and 120 pounds and about 150 clients lost between 120 and 180 pounds.

Learning Objectives
- Acquire knowledge on how to characterize and understand the contour of distributions within histograms.
- Acknowledge aberrations and their implications for data analysis.
Related questions
Number of Innings in the Baseball Games a Major League ...
In May 2014,17 Coffee Shops in Toronto Charged the Following \[\begin{array} ...
The Display Shows the Heights of Grade 12 Students at ...
The Histogram Shows the Sizes (In Acres)of 169 Farms in ...
Members of the Ontario Field Ornithologists (OFO)observe Birds at Various \(\mid ...