Asked by Titanslayer Dicelyon on Jun 26, 2024

Verified
Assume that the population distributions of life expectancy (in years) of men and women are normal with equal variances. Two random samples, drawn independently from the populations, showed the following statistics. 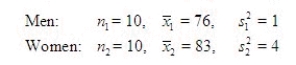 Construct and interpret a 99% confidence interval for the true difference in average life expectancy of men and women.
What is the 99% confidence interval? (CI)
CI = ______________ Enter (n1, n2)
Since this interval does not contain zero, the sample evidence ______________ support that men and women have, on average, different life expectancies..
Life Expectancy
An estimate of the average number of years an individual or organism can expect to live, given current mortality conditions.
Confidence Interval
A series of values, obtained from sampled data, expected to encompass the value of an unobserved population statistic.
Population Distributions
The distribution of values, states, or categories that represent the characteristics of a population from which samples might be drawn.
- Comprehend how to interpret the range of confidence intervals regarding the difference in two population averages.

Verified Answer

Learning Objectives
- Comprehend how to interpret the range of confidence intervals regarding the difference in two population averages.
Related questions
A Child Psychologist Was Interested in the Difference in Age ...
Assume That the Population Distributions of Times (In Minutes) for ...
Two Independent Random Samples of Sizes = 4 and ...
Two Types of Flares Are Tested for Their Burning Times \(\text ...
A Grocery Store Is Interested in Determining Whether or Not \(\mu ...