Asked by Dallas Thompson on Apr 29, 2024

Verified
Compete the table and use the results to sketch the graph of the equation y=∣x−1∣y = | x - 1 |y=∣x−1∣ .
x−2−1012y\begin{array} { | l | l | l | l | l | l | } \hline x & - 2 & - 1 & 0 & 1 & 2 \\\hline y & & & & & \\\hline\end{array}xy−2−1012
A) 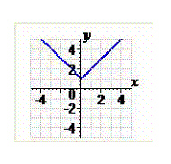
B) 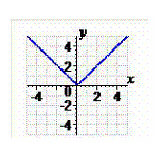
C) 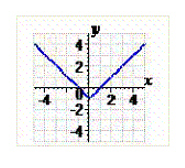
D) 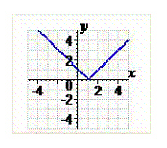
E) 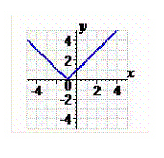
Absolute Value
The absolute value of a number is its distance from zero on the number line, without considering which direction from zero the number lies, always yielding a non-negative result.
Sketch Graph
The act of drawing a rough outline or diagram of a graph, typically to illustrate behavior or solutions.
Equation
A statement that asserts the equality of two expressions, typically including one or more variables.
- Understand and apply the concept of absolute value functions to graph equations.

Verified Answer
ZK
Zybrea KnightMay 03, 2024
Final Answer :
D
Explanation :
To complete the table, we need to substitute each given value of x, one at a time, into the equation $y = | x - 1 |$, and evaluate.
For $x=-2$, $y = | -2 - 1 | = 3$
For $x=-1$, $y = | -1 - 1 | = 2$
For $x=0$, $y = | 0 - 1 | = 1$
For $x=1$, $y = | 1 - 1 | = 0$
For $x=2$, $y = | 2 - 1 | = 1$
Now we can plot these points on the coordinate plane and sketch the graph of $y = | x - 1 |$. The graph is symmetric about the vertical line $x = 1$, and consists of two segments: one with a slope of 1, passing through (1, 0), and another with a slope of -1, passing through (0, 1). The graph looks like a "\V/" shape with its vertex at (1,0), as shown in choice D.

Learning Objectives
- Understand and apply the concept of absolute value functions to graph equations.