Asked by Desiree LeBoeuf on May 01, 2024

Verified
{Computer Training Narrative} Develop a scatter diagram for the data.Does the scatter diagram suggest an estimated regression equation of the form 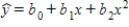 ? Explain.
Scatter Diagram
A graphical representation of data points on a Cartesian coordinate system, used to observe the relationship between two variables.
- Employ regression analysis to estimate future outcomes based on specific data.
- Implement the use of statistical software in executing regression analysis and deciphering the findings.

Verified Answer
ZK
Zybrea KnightMay 08, 2024
Final Answer : 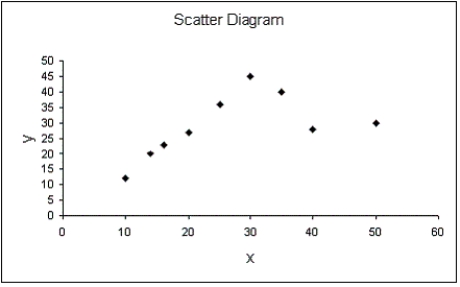 Yes,the scatter diagram suggests that a curvilinear relationship may be appropriate.
Yes,the scatter diagram suggests that a curvilinear relationship may be appropriate.
Learning Objectives
- Employ regression analysis to estimate future outcomes based on specific data.
- Implement the use of statistical software in executing regression analysis and deciphering the findings.
Related questions
{Computer Training Narrative} Develop an Estimated Regression Equation of the ...
{Computer Training Narrative} Determine the Coefficient of Determination Quadratic Model ...
A Random Sample of 150 Yachts Sold in Canada Last \(\mathrm ...
Using the Regression Formula with a Slope = 2,000 and ...
Using the Regression Formula with a Slope = 0 ...