Asked by Arlisa Flores on May 26, 2024

Verified
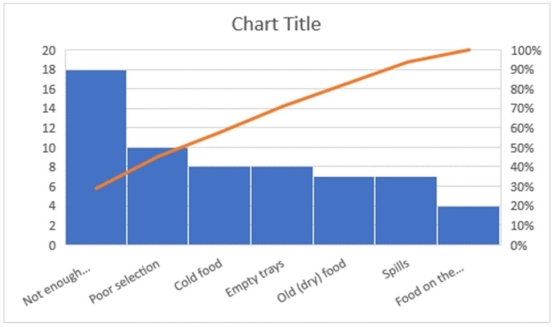
Create a Pareto diagram from the buffet defect information provided in the table below.
Wednesday Cold food 8 Poor selection 10 Empty trays 8 Not enough plates 18 Old (dry) food 7 Spills 7 Food on the floor 4\begin{array}{l}\begin{array} { l c } &\text { Wednesday }\\\text { Cold food } & 8 \\\text { Poor selection } & 10 \\\text { Empty trays } & 8 \\\text { Not enough plates } & 18 \\& \\\text { Old (dry) food } & 7 \\\text { Spills } & 7 \\\text { Food on the floor } & 4\end{array}\end{array} Cold food Poor selection Empty trays Not enough plates Old (dry) food Spills Food on the floor Wednesday 810818774
Pareto Diagram
A graphical tool used for decision-making that highlights the most significant factors in a data set according to the Pareto principle.
- Understand and apply Pareto analysis in identifying major causes of problems from a given dataset.

Verified Answer
CK

Learning Objectives
- Understand and apply Pareto analysis in identifying major causes of problems from a given dataset.