Asked by Jocelyn Cooperwood on Jun 18, 2024

Verified
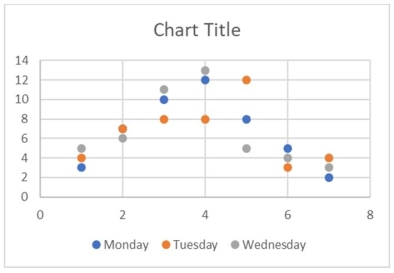
Create a scatter diagram from the buffet defect information provided in the table below.
Monday Tuesday Wednesday Cold food 345 Poor selection 776 Empty trays 10811 Not enough plates 12813 Old (dry) food 8125 Spills 534 Food on the floor 243\begin{array} { l c c c } & \text { Monday } & \text { Tuesday } & \text { Wednesday } \\\text { Cold food } & 3 & 4 & 5 \\\text { Poor selection } & 7 & 7 & 6 \\\text { Empty trays } & 10 & 8 & 11 \\\text { Not enough } & & & \\\text { plates } & 12 & 8 & 13 \\\text { Old (dry) food } & 8 & 12 & 5 \\\text { Spills } & 5 & 3 & 4 \\\text { Food on the floor } & 2 & 4 & 3\end{array} Cold food Poor selection Empty trays Not enough plates Old (dry) food Spills Food on the floor Monday 371012852 Tuesday 47881234 Wednesday 561113543
Scatter Diagram
A graphical representation used to visualize the relationship between two quantitative variables, helping to identify any correlations.
- Understand the process of constructing scatter diagrams to analyze data trends.

Verified Answer
TS

Learning Objectives
- Understand the process of constructing scatter diagrams to analyze data trends.
Related questions
To Determine the Slope of the Variable Cost from a ...
There Are Only Two Methods to Derive an Estimated Line ...
Beef Prices Throughout the Year (Month 1 = January)are Shown ...
Which of the Following Statements Describe(s)the Line Chart Below ...
The Line Chart Below Shows Cucumber Prices Fluctuated from $2 ...