Asked by Paola Reyes on Jun 02, 2024

Verified
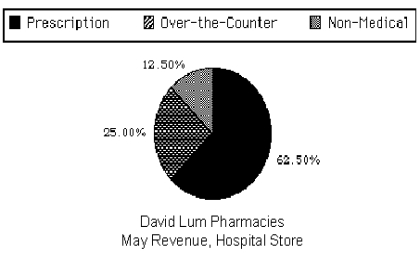
David Lum operates two pharmacies, one near the hospital and a second near the outpatient surgery clinic. Lum categorizes sales revenues as prescription medicine, over-the-counter medicine, or non-medical sales. The revenues from each store for the month of May are shown below. Using Figures 24-9a and 24-9b, construct one circle graph for each store to illustrate the data. Label where necessary.
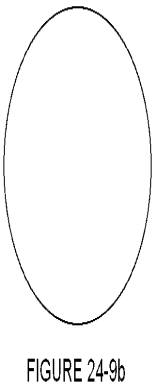
a.Circle graph, Hospital Store

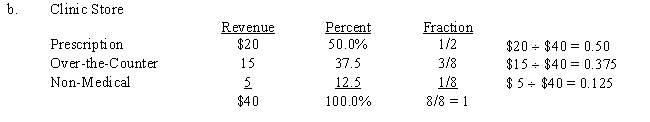
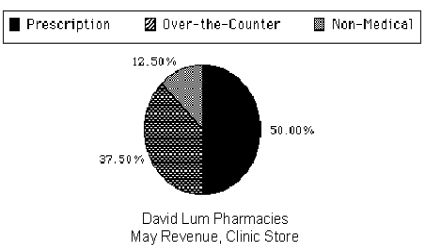
b.Circle graph, Clinic Store

Circle Graph
A circular chart divided into sectors, each representing a proportion of the total; also known as a pie chart.
Sales Revenues
The total amount of money generated from the sale of goods or services before any expenses are subtracted.
Prescription Medicine
Medications that can only be obtained with a written order from a licensed healthcare provider.
- Construct and interpret circle graphs for proportional comparison within categories.

Verified Answer
FB

Learning Objectives
- Construct and interpret circle graphs for proportional comparison within categories.
Related questions
The Scale Used on a Bar Chart Does Not Affect ...
Differences in the Frequencies of a Histogram Appear to Be ...
When Displaying the Distribution of Quantitative Data,it Is Best to ...
Data Are Collected from 1100 Randomly Selected Students Who Graduated ...
A Study Is Being Conducted on Air Quality at a ...