Asked by Stephanie Nieto on Jul 20, 2024

Verified
Figure 4.3 shows the supply curves for baby formula.In the figure given below,which of the following changes is likely to result from an increase in the number of firms producing baby formula?
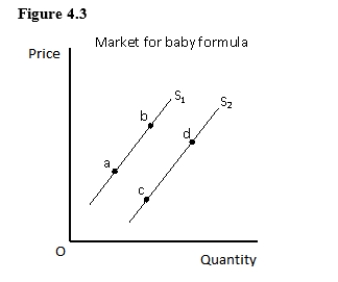
A) A rightward shift of the supply curve from S1 to S2
B) A movement from point a to point b on the supply curve S1
C) A leftward shift of the supply curve from S2 to S1
D) A movement from point c to point d on the supply curve S2
E) A movement from point b to point a on the supply curve S1
Supply Curves
Graphical representations that show the relationship between the price of a good or service and the quantity supplied by producers, assuming other factors remain constant.
Number of Firms
The total count of business entities operating within a particular market or industry.
Supply Curve
A graphical representation showing the relationship between the price of a good and the amount of it that producers are willing to supply.
- Comprehend how market mechanisms (increase or decrease in the number of firms) affect supply.

Verified Answer

Learning Objectives
- Comprehend how market mechanisms (increase or decrease in the number of firms) affect supply.
Related questions
An Agricultural Economist Reports That Corn Prices Are Very High ...
When the Representatives of the OPEC Countries Met in March ...
Suppose It Was Discovered That the Consistent Consumption of Chocolate ...
The Effect on the Market for Heating Oil of a ...
An Exit from an Industry on the Part of Many ...