Asked by Kirstyn Evans on Jun 06, 2024

Verified
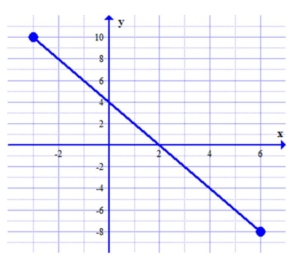
Graph following equation: 2x + y = 4 over the range x = -3 to x = 6
Linear Graphing
A method of representing data or equations where the graph forms a straight line.
- Become proficient in the graphical illustration of mathematical equations.
- Gain an understanding of, and depict graphically, linear and non-linear functions over designated intervals.

Verified Answer
NS

Learning Objectives
- Become proficient in the graphical illustration of mathematical equations.
- Gain an understanding of, and depict graphically, linear and non-linear functions over designated intervals.