Asked by Lacey Harpe on Apr 25, 2024

Verified
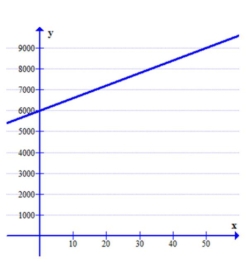
Graph the following equation: y = 60x + 6,000 over the range x = 0 to x = 50
Linear Graphing
A method for representing data or equations that result in a straight line when plotted on a graph.
- Master the technique of expressing equations graphically.
- Acquire the knowledge to map out and interpret linear and non-linear functions throughout set intervals.

Verified Answer
YA

Learning Objectives
- Master the technique of expressing equations graphically.
- Acquire the knowledge to map out and interpret linear and non-linear functions throughout set intervals.