Asked by Renee Sinclair on May 17, 2024

Verified
Graph the solution to the inequality on the real number line. x(x+3) (x−3) >0x ( x + 3 ) ( x - 3 ) > 0x(x+3) (x−3) >0
A) 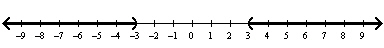
B) 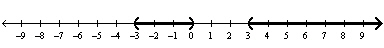
C) 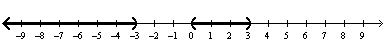
D) 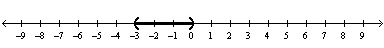
E) none of these
Real Number Line
A visual representation of all real numbers arranged in order of value on a straight, horizontal line.
Inequality
A mathematical statement that shows the relationship between quantities that are not necessarily equal, using symbols like <, >, ≤, and ≥.
- Render solutions for inequalities on the axis of real numbers.

Verified Answer
MA
Maidul AhsanMay 20, 2024
Final Answer :
B
Explanation :
The zeros of the function are -3, 0, and 3.
To determine the sign of the inequality for each interval, we can use test points:
Test x=-4: (-4)(-1)(-7)=-28<0, so the inequality is false for x<-3.
Test x=-2: (-2)(1)(-5)=10>0, so the inequality is true for -3Test x=1: (1)(4)(-2)=-8<0, so the inequality is false for 0Test x=4: (4)(7)(1)=28>0, so the inequality is true for x>3.
Therefore, the solution is x<-3 or 0

Learning Objectives
- Render solutions for inequalities on the axis of real numbers.
Related questions
Solve the Inequality \(\frac { x - 1 } { x ...
Determine If the Ordered Pair ( 18,0 ) Is a Solution ...
Graph the System of Linear Inequalities Below \[\left\{ \begin{array} { l ...
Graph the System of Linear Inequalities Below \[\left\{ \begin{array} { l ...
Use a Graphing Calculator to Approximate the Values of X \(x ...