Asked by Jessica Romero on Jun 10, 2024

Verified
Here are plots of data for Studentized residuals against Length. 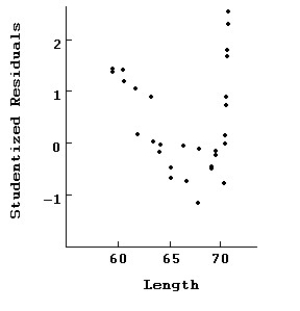 Here is the same regression with all of the points at 70 removed.
Dependent variable is: Weight
30 total bears of which 10 are missing
R-squared = 97.8% R-squared (adjusted)= 97.3%
s = 2.96 with 20 - 4 = 16 degrees of freedom Sum of Mean Source Squares DF Square F-ratio Regression 7455.032485238.26 Residual 166.891610.43\begin{array} { l r r r r } & \text { Sum of } & & { \text { Mean } } \\\text { Source } & \text { Squares } & \text { DF } & \text { Square } & \text { F-ratio } \\\text { Regression } & 7455.0 & 3 & 2485 & 238.26 \\\text { Residual } & 166.89 & 16 & 10.43 &\end{array} Source Regression Residual Sum of Squares 7455.0166.89 DF 316 Mean Square 248510.43 F-ratio 238.26 Variable Coefficient SE(Coeff) t-ratio P-value Intercept −169.163.23−52.37<0.0001 Chest 0.840.581.450.1590 Length 5.592.142.610.0148 Sex −1.191.98−0.600.5537\begin{array} { l r c r r } \text { Variable } & \text { Coefficient } & \text { SE(Coeff) } & \text { t-ratio } & \text { P-value } \\\text { Intercept } & - 169.16 & 3.23 & - 52.37 & < 0.0001 \\\text { Chest } & 0.84 & 0.58 & 1.45 & 0.1590 \\\text { Length } & 5.59 & 2.14 & 2.61 & 0.0148 \\\text { Sex } & - 1.19 & 1.98 & - 0.60 & 0.5537\end{array} Variable Intercept Chest Length Sex Coefficient −169.160.845.59−1.19 SE(Coeff) 3.230.582.141.98 t-ratio −52.371.452.61−0.60 P-value <0.00010.15900.01480.5537 Compare the regression with the previous one.In particular,which model is likely to make the best prediction of weight? Which seems to fit the data better?
Studentized Residuals
Residuals divided by an estimate of their standard deviation, used for identifying outliers in regression analysis.
R-Squared
A statistical measure that represents the proportion of the variance for a dependent variable that's explained by an independent variable or variables in a regression model.
F-Ratio
A statistical measure used in the analysis of variance (ANOVA) to compare the variability between groups with the variability within groups.
- Evaluate model fit and choose between models based on statistical measures and diagnostic plots.

Verified Answer

Learning Objectives
- Evaluate model fit and choose between models based on statistical measures and diagnostic plots.
Related questions
Data Were Obtained in a Study of the Oxygen Uptake ...
Here Are Plots of Data for Studentized Residuals Against Chest ...
Here Is a Histogram of Leverages for This Regression ...
Here Is the Scatterplot of Externally Studentized Residuals Against Predicted ...
An Actuary Wanted to Develop a Model to Predict How ...