Asked by Marina Aschilean on Jun 19, 2024

Verified
{Holiday Hours Narrative} Calculate the seasonal indexes based on the regression trend line in the previous question.
Seasonal Indexes
Factors used to adjust or measure variations in data due to seasonal effects over specific periods, often applied in forecasting and economic analysis to account for seasonal patterns.
Regression Trend Line
is a statistical tool used in scatter plots to determine the relationship between two variables by drawing a straight line that best fits the data points.
- Acquire knowledge on the concept and implementation of seasonal indexes in time series data.
- Anticipate upcoming values through modifications according to trends and seasonality factors.

Verified Answer
 for each value of t and compute the ratio
  .The ratios associated with each quarter,the averages,and the seasonal indexes are shown below.
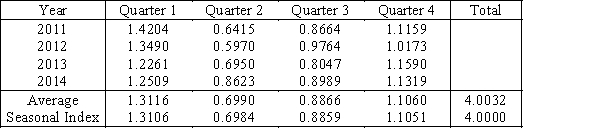

Learning Objectives
- Acquire knowledge on the concept and implementation of seasonal indexes in time series data.
- Anticipate upcoming values through modifications according to trends and seasonality factors.
Related questions
One Application of Seasonal Indexes Is to Remove the Seasonal ...
The Way a Seasonal Index Is Computed Involves Which of ...
Seasonal Variation Is One of the Four Different Components of ...
A Seasonal Index for a Monthly Series Is About to ...
{Daily Hoagie Sales Narrative} Calculate the Seasonal (Daily)indexes,using the Trend ...