Asked by Ahmed Ismail on Apr 23, 2024

Verified
In a recent study,over 33,000 women were asked,"Did you have a mammogram within the last 2 years?" Despite the benefits of screening,about 30% of respondents indicated that they had not had a recent mammogram.The dependent/outcome variable was the proportion of women who reported a recent mammogram.In addition,the following information was collected on each individual: age (40-49,50-64,65-74,75-84) ,race/ethnicity (Latina,Non-Latina African American,Non-Latina Asian/Pacific Islander,Non-Latina White,and Non-Latina other race/ethnicity) ,marital status (married or living with partner vs.not currently married) ,history of breast cancer (yes vs.no) ,self-rated health (excellent,very good,good,fair,poor) ,currently with health insurance (yes vs.no) ,and having a usual source of care (yes vs.no) .All variables were treated as categorical (e.g. ,coded as 1 or 0 for each category) .A multiple logistic regression model was fitted to the data to predict the probability a woman had a recent mammogram.Software output from SAS is shown below. 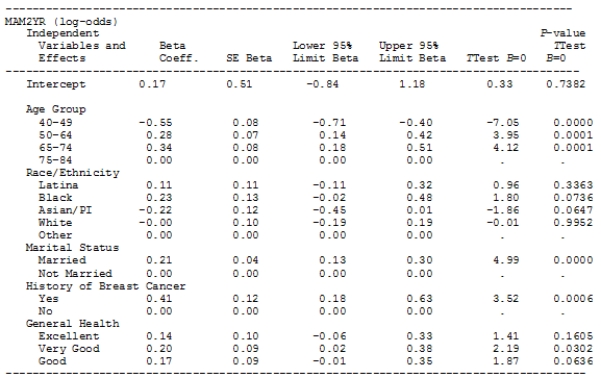 What are the odds that a woman did not have a mammogram within the last 2 years?
A) 2.33
B) 0.428
C) 0.3
D) 0.7
Odds
A statistical term representing the likelihood that an event will occur, expressed as the ratio of the event's probability to its non-occurrence.
Mammogram
An X-ray picture of the breast used to detect and diagnose breast diseases, such as cancer.
Recent Mammogram
An X-ray photograph of the breast taken recently, usually within the past year, to detect cancer or other abnormalities.
- Understand the output generated by software when conducting logistic regression analysis.

Verified Answer
YM
Yostina MaximoosMay 02, 2024
Final Answer :
B
Explanation :
The odds that a woman did not have a mammogram within the last 2 years can be calculated by taking the exponential of the coefficient for the intercept, which is -0.847. Thus, the odds are exp(-0.847) = 0.428. This means that the odds of a woman not having a recent mammogram are about 42.8% (or 0.428/(1+0.428)). Therefore, the best choice is B.

Learning Objectives
- Understand the output generated by software when conducting logistic regression analysis.