Asked by Writes Wanderlust on Apr 25, 2024

Verified
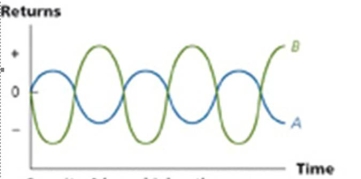
Provide a graphical representation of the volatility of two negatively correlated stocks over time.
Negatively Correlated Stocks
Stocks that move in opposite directions; when the price of one increases, the price of the other tends to decrease.
Volatility
A statistical measure of the dispersion of returns for a given security or market index, often used to gauge risk.
- Comprehend the theoretical and computational approaches to charting and decoding the fluctuation of stocks and portfolios via graphical illustrations.

Verified Answer
SM

Learning Objectives
- Comprehend the theoretical and computational approaches to charting and decoding the fluctuation of stocks and portfolios via graphical illustrations.
Related questions
Provide a Graphical Representation of the Volatility of Two Positively ...
Provide a Graphical Representation of a High Versus Low Stock ...
Provide a Graphical Representation of the Opportunity Sets of Two ...
Provide a Graphical Representation of the Volatility of Two Stocks ...
Provide a Graphical Representation of the Volatility of the Efficient ...