Asked by Kevin Huynh on Jun 04, 2024

Verified
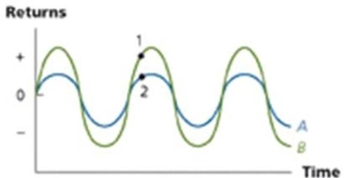
Provide a graphical representation of the volatility of two positively correlated stocks over time.
Positively Correlated Stocks
Stocks whose prices tend to move in the same direction due to similar underlying factors or market conditions.
Volatility
A statistical measure of the dispersion of returns for a given security or market index, often associated with the degree of risk or uncertainty.
- Master the foundational and arithmetic strategies for mapping and elucidating the volatility of stocks and portfolios using graphic representations.

Verified Answer
JJ

Learning Objectives
- Master the foundational and arithmetic strategies for mapping and elucidating the volatility of stocks and portfolios using graphic representations.
Related questions
Provide a Graphical Representation of the Volatility of the Efficient ...
Provide a Graphical Representation of the Volatility of Two Stocks ...
Provide a Graphical Representation of the Opportunity Sets of Two ...
Provide a Graphical Representation of the Volatility of Two Negatively ...
Provide a Graphical Representation of a High Versus Low Stock ...