Asked by Samende Kamana on May 12, 2024

Verified
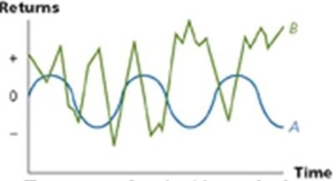
Provide a graphical representation of the volatility of two stocks that are not correlated.
Not Correlated Stocks
Stocks whose price movements are independent of each other, indicating no direct relationship in their performance.
Volatility
The degree of variation of a trading price series over time, usually measured by the standard deviation of logarithmic returns.
- Acquire knowledge on the conceptual and numerical techniques for illustrating and analyzing the instability of stocks and portfolios through visual diagrams.

Verified Answer
JH

Learning Objectives
- Acquire knowledge on the conceptual and numerical techniques for illustrating and analyzing the instability of stocks and portfolios through visual diagrams.
Related questions
Provide a Graphical Representation of the Volatility of Two Negatively ...
Provide a Graphical Representation of the Volatility of the Efficient ...
Provide a Graphical Representation of the Opportunity Sets of Two ...
Provide a Graphical Representation of the Volatility of Two Positively ...
Provide a Graphical Representation of a High Versus Low Stock ...