Asked by Esmer Çetin on Jun 11, 2024

Verified
Students were asked to make a histogram of the number of corn snakes collected in Will County,Illinois from 1985 to 2006.They were given the data in the form of a stem-and-leaf display shown below: 0123456\begin{array} { l| } 0 \\1 \\2 \\3 \\4 \\5 \\6\end{array}0123456 2417899013786992247035\begin{array} { l } 24 \\17899 \\01378 \\699 \\224 \\7 \\035\end{array}2417899013786992247035 5 ∣5~|5 ∣ 777 = 57 corn snakes
One student submitted the following display: 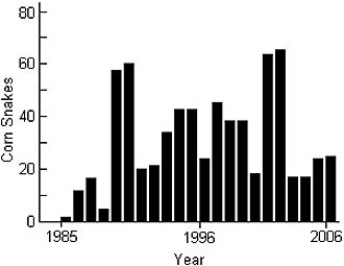 a)Comment on this graph.
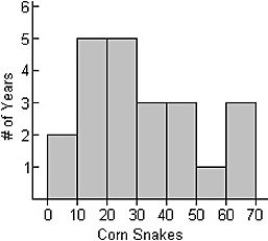
b)Create your own histogram of the data.
Corn Snakes
A species of rat snake, Pantherophis guttatus, known for its relatively docile temper and being harmless to humans, often kept as pets.
Histogram
A graphical representation of data distribution through a series of bars, with each bar representing the frequency of data in certain intervals.
Illinois
A state located in the Midwestern region of the United States, known for its significant agricultural productivity and major cities like Chicago.
- Comprehend the development and analysis of histograms.
- Capability to understand stem-and-leaf presentations for examining data distribution patterns.

Verified Answer

Learning Objectives
- Comprehend the development and analysis of histograms.
- Capability to understand stem-and-leaf presentations for examining data distribution patterns.
Related questions
In a Survey,20 People Were Asked How Many Magazines They ...
The Mathematics Department at a Canadian University Collected Data for ...
The Data Below Represent the Midterm Grades for 24 Students ...
The Weights,in Kilograms,of the Members of the Varsity Football Team ...
The Diastolic Blood Pressures,in Mm Hg,for a Sample of Patients ...