Asked by Juliet Sebastian on Jun 13, 2024

Verified
This information is available for Sheena's Photo Corporation for 2016 and 2017. 2016‾2017‾ Beginning inventory $200,000$300,000 Ending inventory 300,000365,000 Cost of goods sold 1,200,0001,330,000 Sales revenue 1,600,0001,900,000\begin{array} { l r r } &\underline { 2016 } & \underline { 2017 } \\\text { Beginning inventory } & \$ 200,000 & \$ 300,000 \\\text { Ending inventory } & 300,000 & 365,000 \\\text { Cost of goods sold } & 1,200,000 & 1,330,000 \\\text { Sales revenue } & 1,600,000 & 1,900,000\end{array} Beginning inventory Ending inventory Cost of goods sold Sales revenue 2016$200,000300,0001,200,0001,600,0002017$300,000365,0001,330,0001,900,000 Instructions
Calculate inventory turnover days in inventory and gross profit rate for Sheena's Photo Corporation for 2016 and 2017. Comment on any trends.
Inventory Turnover
A metric indicating how many times a company's inventory is sold and replaced over a particular period, demonstrating the efficiency of inventory management and sales performance.
Gross Profit Rate
The gross profit rate, or gross margin, is the percentage of revenue that exceeds the cost of goods sold, which indicates the efficiency of a company in producing and selling its products.
- Determine and compute the principal inventory ratios and their importance in assessing a company's operational effectiveness.

Verified Answer
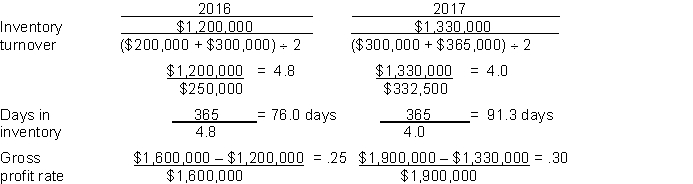 The inventory turnover decreased by approximately 17% from 2016 to 2017 while the days in inventory increased by 20% over the same time period. Both of these changes would be considered negative since it's better to have a higher inventory turnover and lower days in inventory. However Sheena's Photo gross profit rate increased by 20% from 2016 to 2017 which is a positive sign.
Learning Objectives
- Determine and compute the principal inventory ratios and their importance in assessing a company's operational effectiveness.
Related questions
At December 31 2016 the Following Information Was Available for ...
Cutting Edge Technologies Reported the Following Information in Its 2019 ...
Powers Company Reported Net Sales of $1,200,000,average Accounts Receivable,net of ...
Runyon Inc ...
Which of the Following Segment Performance Measures Will Decrease If ...