Asked by Rosie Sangi on Jul 14, 2024

Verified
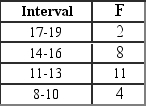
Using the numbers in Exhibit 6-1, draw a frequency distribution using class intervals of 3.
Class Intervals
The range of values into which data points in a dataset are grouped for the purpose of creating a frequency distribution.
Frequency Distribution
A statistical representation showing the number of times each value appears in a dataset, often visualized as a table or graph.
- Acquire the skill to create and understand frequency distributions, histograms, and ogive curves.

Verified Answer
SW

Learning Objectives
- Acquire the skill to create and understand frequency distributions, histograms, and ogive curves.
Related questions
A Histogram Is the Preferred Method Over the Cumulative Distribution ...
Refer to Exhibit 6-1 ...
Histograms and Frequency Polygons Are Visual Representations of Frequency Distributions
Refer to Exhibit 6-2. Draw a Frequency Distribution
A Histogram Conveys the Same Information That a Frequency Polygon ...