GM
Grace Mwangi
Answers (6)
GM
Answered
The number of observations within each class may be found in a frequency distribution.
On Aug 07, 2024
True
GM
Answered
When you ______, this implies the probability of the statistic is ______.
A) do not reject the null hypothesis; in the region of rejection
B) do not reject the null hypothesis; < 5%
C) do not reject the null hypothesis; high
D) reject the null hypothesis; in the region of acceptance
A) do not reject the null hypothesis; in the region of rejection
B) do not reject the null hypothesis; < 5%
C) do not reject the null hypothesis; high
D) reject the null hypothesis; in the region of acceptance
On Aug 01, 2024
C
GM
Answered
The Shoe Shop's normal rate of mark-up on selling price is 45%. What rate of markdown can the store offer on a pair of shoes normally priced at $140, and still realize a 20% rate of mark-up on cost at the sale price?
On Jul 04, 2024
34.0%
GM
Answered
Which set has the largest standard deviation? Set 1 Set 2377710367810\begin{array} { c c c c c | c c c c c } \text { Set } 1 &&&&& \text { Set } 2 \\\hline 3 & 7 & 7 & 7 & 10 & 3 & 6 & 7 & 8 & 10\end{array} Set 1377710 Set 2367810
A) Neither,because set 1 and set 2 have the same standard deviation.
B) Set 1,because 7 and 7 in set 1 are farther from 7 than 6 and 8 in set 2.
C) Set 1,because 6 and 8 in set 1 are farther from 7 than 7 and 7 in set 2.
D) Set 2,because 6 and 8 in set 2 are farther from 7 than 7 and 7 in set 1.
E) Set 2,because 7 and 7 in set 2 are farther from 7 than 6 and 8 in set 1.
On Jul 01, 2024
D
GM
Answered
The Centers for Disease Control in the U.S.A.lists causes of death for individual states in 2002.The mortality data for the five leading causes of death for one state is given. Cause of Death Percent Heart Disease 28.5% Cancer 23.2% Circulatory diseases and stroke 7.5% Respiratory diseases 5.5% Accidents 4.8%\begin{array} { l | c } { \text { Cause of Death } } & \text { Percent } \\\hline \text { Heart Disease } & 28.5 \% \\\text { Cancer } & 23.2 \% \\\text { Circulatory diseases and stroke } & 7.5 \% \\\text { Respiratory diseases } & 5.5 \% \\\text { Accidents } & 4.8 \%\end{array} Cause of Death Heart Disease Cancer Circulatory diseases and stroke Respiratory diseases Accidents Percent 28.5%23.2%7.5%5.5%4.8% Which of the following displays is/are appropriate to describe the data for all causes of death? (More than one display may be appropriate.)
I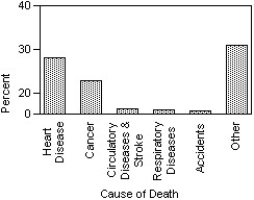
II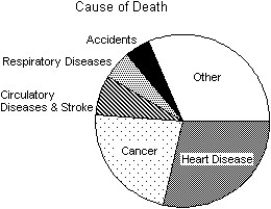
III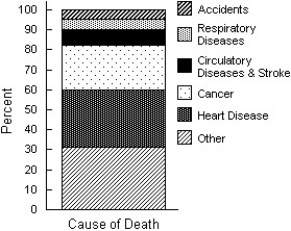
A) I,II
B) I,II,III
C) II,III
D) II
E) None of these displays are appropriate.
I
II
III
A) I,II
B) I,II,III
C) II,III
D) II
E) None of these displays are appropriate.
On Jun 02, 2024
C
GM
Answered
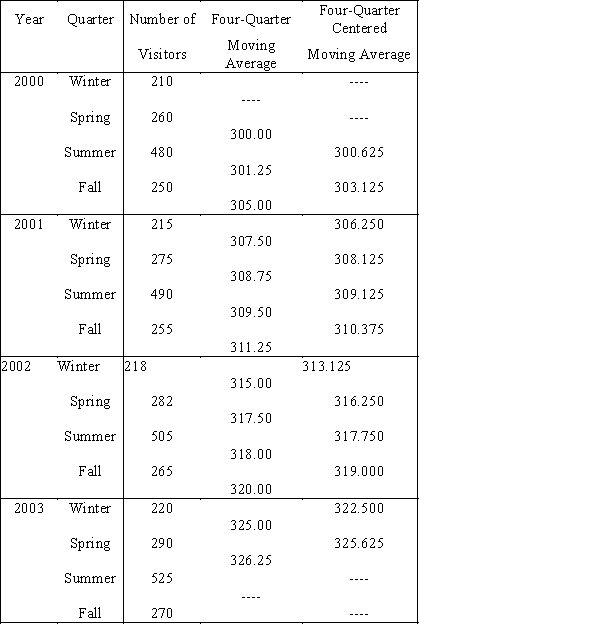
{The Pyramids of Giza Narrative} Calculate the four-quarter centered moving averages.
On May 30, 2024