JF
Jason Folbigg
Answers (7)
JF
Answered
Which of the following would not usually be found in the articles of incorporation of a corporation?
A) The number of directors necessary for a quorum.
B) The name of the corporation.
C) The name and address of each incorporator.
D) The number of authorized shares.
A) The number of directors necessary for a quorum.
B) The name of the corporation.
C) The name and address of each incorporator.
D) The number of authorized shares.
On Jul 14, 2024
A
JF
Answered
Poor economies tend to have high education levels and high literacy rates.
On Jul 14, 2024
False
JF
Answered
Robert Hayden sells metal gazebos. He approaches a large retail chain of home improvement stores. He decides beforehand to sell 10 pieces to their regional procurement manager. In terms of the acronym "SMART", his primary objective is to:
A) have a targeted rate of return.
B) be specific.
C) put customer service first.
D) maximize the customer's order.
E) relate to the present and future needs of the customer.
A) have a targeted rate of return.
B) be specific.
C) put customer service first.
D) maximize the customer's order.
E) relate to the present and future needs of the customer.
On Jul 12, 2024
B
JF
Answered
When the value of a firm's assets exactly equals the value of its debt, the firm:
A) Is economically bankrupt.
B) Is technically insolvent.
C) Is legally bankrupt.
D) Is in liquidation.
E) Is in default.
A) Is economically bankrupt.
B) Is technically insolvent.
C) Is legally bankrupt.
D) Is in liquidation.
E) Is in default.
On Jun 13, 2024
A
JF
Answered
If IBM introduces a new software package in January,Microsoft can probably imitate or duplicate this package by February of the same year.However,if IBM technical support people are trained and motivated to provide "knock your socks off service," Microsoft will have a difficult time imitating this service within a month.This is an example of how employees can provide a competitive advantage.What theory is being applied here?
A) behavioural perspective
B) resource-based view
C) human capital
D) strategic management
A) behavioural perspective
B) resource-based view
C) human capital
D) strategic management
On Jun 12, 2024
B
JF
Answered
Refer to the diagram below to answer this question. 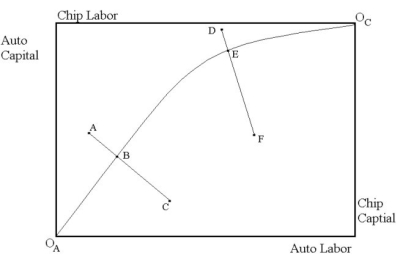 The Edgeworth Box diagram above refers to input usage in the automobile industry and the computer chip industry. The contract curve is given by
 . All points on this curve correspond to input prices being equivalent across industries. For example, the line segment AC indicates the input price ratio at point B in the two industries. Also, line segment DF indicates the input price ratio at point E in the two industries. The diagram below presents the production possibilities frontier for automobiles and computer chips.
 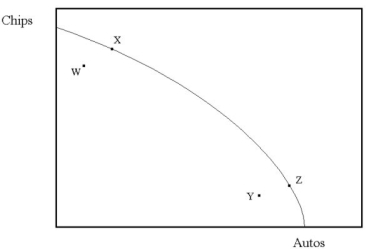 The labeled points in the production possibilities frontier diagram correspond to the points A, B, E, and F in the Edgeworth Box diagram above. Which points in the production possibilities frontier diagram correspond to which points in the Edgeworth Box diagram? Why?
The Edgeworth Box diagram above refers to input usage in the automobile industry and the computer chip industry. The contract curve is given by . All points on this curve correspond to input prices being equivalent across industries. For example, the line segment AC indicates the input price ratio at point B in the two industries. Also, line segment DF indicates the input price ratio at point E in the two industries. The diagram below presents the production possibilities frontier for automobiles and computer chips. The labeled points in the production possibilities frontier diagram correspond to the points A, B, E, and F in the Edgeworth Box diagram above. Which points in the production possibilities frontier diagram correspond to which points in the Edgeworth Box diagram? Why?On May 14, 2024
Point A must correspond to point W. We know that point A is not an efficient production level because the input prices are not equal across industries. Further, we know that point A provides smaller output of automobiles than point B. In fact, point A must provide the smallest automobile production than all points labeled in the PPF. This is because the automobile industry is using the least amount of inputs at this point. Point B must correspond to point X. We know that point B is efficient and must lie on the production possibilities frontier because input prices are equal across industries. We also know that automobile production at point B must be below automobile production at point E. This implies that point B corresponds to point X. Point E must correspond to point Y. We know that point E is efficient, as input prices are equal across the two industries. Also, point E provides for greater automobile production than point B. Thus, point E corresponds to point Y. This means point F corresponds to point Z.
JF
Answered
Which of the following is not a required disclosure regarding intangible assets in the period a company acquires intangible assets?
A) the cost of any intangible assets acquired, separated into assets subject to amortization, assets not subject to amortization, and goodwill
B) for assets subject to amortization, the residual value and the weighted-average amortization period
C) the cost of any research and development acquired and written off, and where it is included in the income statement
D) the rate of return used to estimate the value of goodwill purchased
On May 13, 2024
D