MB
Mikhail Brich
Answers (4)
MB
Answered
The sensitivity chart displays the rankings of each assumption according to their impact on a forecast cell as a(n) ________.
A) line chart
B) column chart
C) histogram
D) bar chart
A) line chart
B) column chart
C) histogram
D) bar chart
On Jun 28, 2024
D
MB
Answered
A national standardized testing company can tell you your relative standing on an exam without divulging the mean or the standard deviation of the exam scores.
On Jun 16, 2024
True
MB
Answered
Determine the present value (accurate to the cent) of the ordinary general annuity:

On May 20, 2024
$50,859.93
MB
Answered
Each of the following annuities involves future values. Compute the missing numbers. Use Tables 23-1A and 23-1B or a calculator. 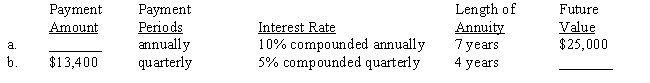
On May 17, 2024
