SW
Saesha Williams
Answers (2)
SW
Answered
The distance between the 25th percentile and the median is always the same as the distance between the median and the 75th percentile.
On Sep 24, 2024
False
SW
Answered
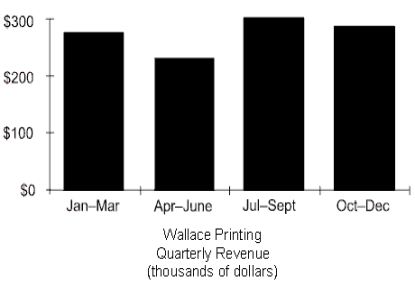
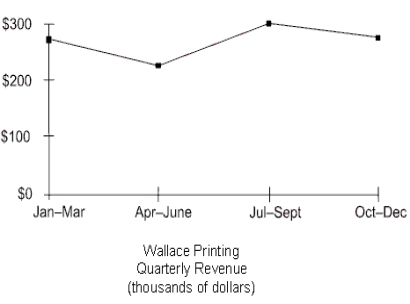
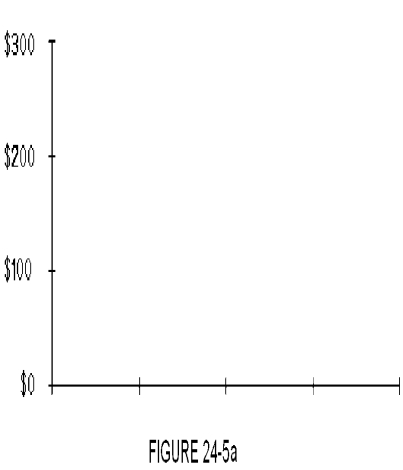
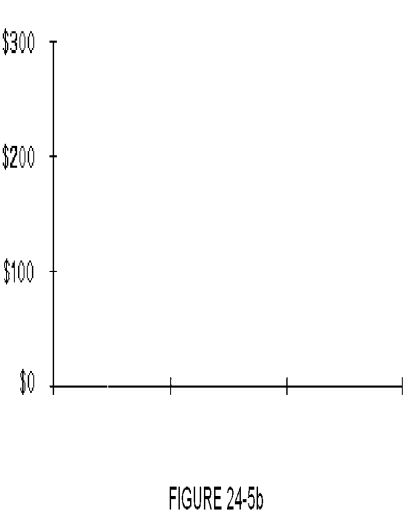
The table below displays the quarterly revenue of Wallace Printing for this year, arranged by quarter. The numbers are all in thousands of dollars. Use Figure 24-5a and Figure 24-5b to construct a bar graph and a line graph for the data. Label where necessary.

a.Bar graph
b.Line graph
a.Bar graph
b.Line graph
On Sep 22, 2024