SC
Simona Coetzee
Answers (5)
SC
Answered
A visual representation of data can be a much more effective way of illustrating the characteristics of a distribution or data set as compared to numerical values alone.
On Jun 13, 2024
True
SC
Answered
Chris's taxable income is $60,709.She is married,filing jointly.What is her tax? 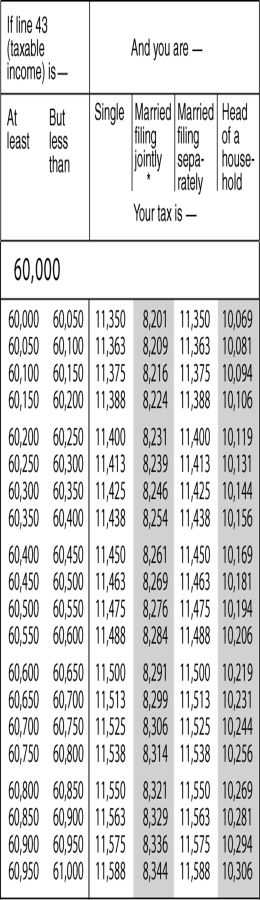
On Jun 12, 2024
$8,306
SC
Answered
Find the critical numbers of x2−7x+10x ^ { 2 } - 7 x + 10x2−7x+10 .
A) −2,−5- 2 , - 5−2,−5
B) 0,50,50,5
C) 2,52,52,5
D) 2,−52 , - 52,−5
E) 0,20,20,2
A) −2,−5- 2 , - 5−2,−5
B) 0,50,50,5
C) 2,52,52,5
D) 2,−52 , - 52,−5
E) 0,20,20,2
On May 14, 2024
C
SC
Answered
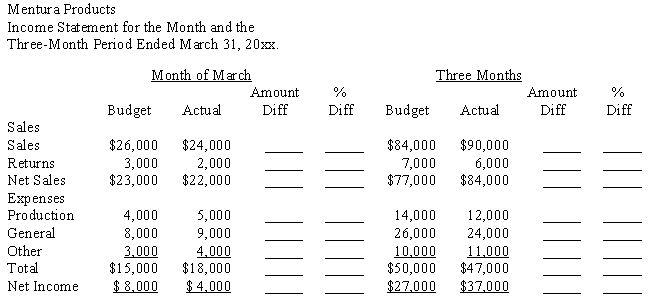
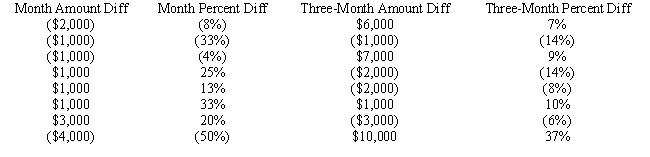
The Income Statement for Mentura Products for the Month and Three-Month Period Ended March 31, 20xx is shown below. Show the Amount and Percent of Differences from the Budgeted Amounts for the Month and the Three-Month Periods. (Round answer to the nearest whole percent.)
On May 13, 2024
SC
Answered
What is the present value of $300 monthly loan payments for two years if money earns 7.5% compounded quarterly?
On May 11, 2024
$6,669.85