SD
Sylvia Dooley
Answers (6)
SD
Answered
Laureysens,et al.(2004) studied the concentration of aluminum in wood from a number of clones of poplar growing in an area with heavy pollution.The same clone was sampled and tested once in August and again in November.The researchers believed that the concentration of aluminum would be shown to be increasing over time and hence higher in November than in August.The following table gives the aluminum concentrations for twelve of the clones. 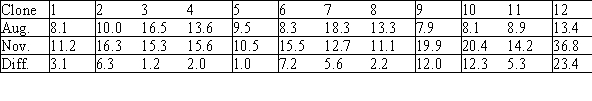 The data are to be analyzed using the Wilcoxon signed rank test.The null hypothesis they established was that the values of aluminum concentrations in the 2 months have the same distribution.What should the researchers establish as the appropriate alternative hypothesis?
A)

B) Values of aluminum concentrations are not the same in the 2 months.
C) For the differences (November - August) ,Ha:
> 0.
D) Values of aluminum concentrations are systematically larger in November than in August.
E)

The data are to be analyzed using the Wilcoxon signed rank test.The null hypothesis they established was that the values of aluminum concentrations in the 2 months have the same distribution.What should the researchers establish as the appropriate alternative hypothesis?A)
B) Values of aluminum concentrations are not the same in the 2 months.
C) For the differences (November - August) ,Ha:
> 0.
D) Values of aluminum concentrations are systematically larger in November than in August.
E)
On Jun 03, 2024
D

SD
Answered
Your client invests $10,000 today at a rate of return of 7.7% compounded quarterly. Rounded to the nearest month, how long will it take the investment to grow to $22,000?
On May 07, 2024
10 years and 4 months
SD
Answered
Your home is on a square lot. To add more space to your yard, you purchase an additional 30 feet along the side of your property (see figure) . The area of the lot is now 43,875 square feet. What are the dimensions of the new lot?
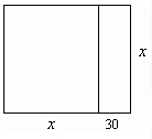
A) 180 feet by 210 feet
B) 180 feet by 240 feet
C) 165 feet by 195 feet
D) 195 feet by 225 feet
E) 225 feet by 420420420 feet
A) 180 feet by 210 feet
B) 180 feet by 240 feet
C) 165 feet by 195 feet
D) 195 feet by 225 feet
E) 225 feet by 420420420 feet
On May 04, 2024
D
SD
Answered
The owner of a property listed at $195,000 is considering two offers. Mr. and Mrs. Sharpe are offering $191,000 cash. The Conlins' "full-price" offer consists of $65,000 cash and a mortgage back to the vendor for $130,000 at a rate of 7.5% compounded semi-annually with payments of $1,000 per month for a five-year term. If current five-year rates are 8.5% compounded semi-annually, what is the equivalent cash value of the Conlins' offer? Which offer should be accepted?
On Apr 30, 2024
Cash value of Conlin's offer = $190,115.19; Sharpe offer should be accepted
SD
Answered
A random sample of n = 36 observations from a quantitative population produced a mean  = 2.5 and a standard deviation s = 0.30. Suppose your research objective is to show that the population mean
  exceeds 2.4.
Find the standard error of the mean.
______________
Do the data provide sufficient evidence to indicate that > 2.3. Test at
  = 0.05.
Test statistic = ______________
Critical Value(s) = ______________
Conclusion: ______________
Interpretation: __________________________________________
Calculate the p-value for the test statistic above.
p-value = ______________
Use the p-value to draw a conclusion at the 5% significance level.
Conclusion: ______________
Compare the two conclusions. Are they the same?
______________
Find the critical value of used for rejecting H0.
______________
Calculate = P(accept H0 when
  = 2.5).
______________
= 2.5 and a standard deviation s = 0.30. Suppose your research objective is to show that the population mean exceeds 2.4.Find the standard error of the mean.
______________
Do the data provide sufficient evidence to indicate that
> 2.3. Test at = 0.05.Test statistic = ______________
Critical Value(s) = ______________
Conclusion: ______________
Interpretation: __________________________________________
Calculate the p-value for the test statistic above.
p-value = ______________
Use the p-value to draw a conclusion at the 5% significance level.
Conclusion: ______________
Compare the two conclusions. Are they the same?
______________
Find the critical value of
used for rejecting H0.______________
Calculate
= P(accept H0 when = 2.5).______________
On Apr 27, 2024
0.05; 2.0; 1.645; Reject H0; The population mean exceeds 2.4; 0.0228; Reject H0; Yes; 2.48; 0.3446