CG
celina gaytan
Answers (5)
CG
Answered
One way to reduce the margin of error in a confidence interval is to decrease the confidence coefficient.
On Jun 16, 2024
True
CG
Answered
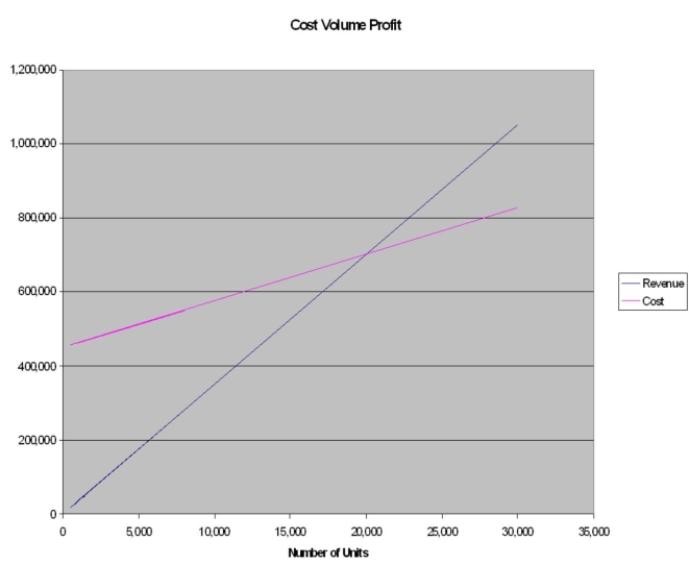
A company expects to sell 30,000 hats at $35 each. The estimated variable cost of each hat is $12.50, and the fixed costs are estimated to be $450,000. Calculate the break-even point in units and revenue. Use the graphical approach to CVP analysis to solve.
On Jun 10, 2024
20,000; $700,000
CG
Answered
Which confidence interval is the narrowest?
A) 99.9%
B) 99%
C) 95%
D) 90%
A) 99.9%
B) 99%
C) 95%
D) 90%
On May 12, 2024
D
CG
Answered
Convert the following fraction to its decimal equivalent and percent equivalent values, rounded to five figures:
16\frac{1}{6}61
16\frac{1}{6}61
On May 11, 2024
0.16667 = 16.667%
