CP
cielo pantoja
Answers (6)
CP
Answered
Maureen, who frequently developed gadgets, had an idea for a machine that could feed her animals (cats, dogs, rabbits, and fish) while she was away on vacation for a week. She was very sure of the idea and began discussions with a manufacturer. Unfortunately, after it was concluded that he could make the machine, they could not agree on his proper compensation and they broke off negotiations. Shortly afterwards, this manufacturer, Easylife Ltd., began to manufacturer "the animal feeder" based on her idea. On these facts, which of the following is true?
A) The manufacturer could not be sued for misuse of a trade secret because he was not Maureen's employee and thus was not in a position of trust and could use the information for his own benefit.
B) The manufacturer could not be sued for misuse of a trade secret because Maureen only told her idea and ideas cannot be protected by trade secret law.
C) The manufacturer could not be sued for misuse of a trade secret because he had not signed any document in which he acknowledged he understood it was confidential information and in which he promised not to use it to her detriment.
D) Maureen could not sue the manufacturer for infringement of copyright but could sue for misuse of a trade secret if she can show that it was apparent in the circumstances that he was being trusted with confidential information.
E) Maureen has no action against the manufacturer because she had not patented her invention.
On Jul 25, 2024
D
CP
Answered
Figure 4.3 shows the supply curves for baby formula.In the figure given below,which of the following changes is likely to result from an increase in the number of firms producing baby formula?
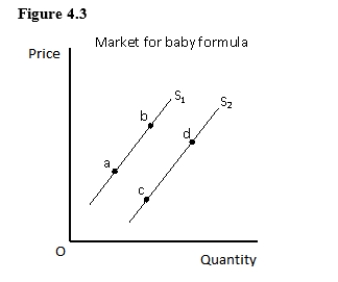
A) A rightward shift of the supply curve from S1 to S2
B) A movement from point a to point b on the supply curve S1
C) A leftward shift of the supply curve from S2 to S1
D) A movement from point c to point d on the supply curve S2
E) A movement from point b to point a on the supply curve S1
A) A rightward shift of the supply curve from S1 to S2
B) A movement from point a to point b on the supply curve S1
C) A leftward shift of the supply curve from S2 to S1
D) A movement from point c to point d on the supply curve S2
E) A movement from point b to point a on the supply curve S1
On Jul 22, 2024
A
CP
Answered
All of the following are guidelines that help in developing more effective relationships with the legislature EXCEPT for ______.
A) establish trust and build confidence
B) develop an agency protocol
C) ensure constant inquiries
D) understand the legislative process
A) establish trust and build confidence
B) develop an agency protocol
C) ensure constant inquiries
D) understand the legislative process
On Jun 23, 2024
C
CP
Answered
A straight bill of lading:
A) is used when the goods have been paid for in advance of shipment and requires delivery.
B) is a negotiable instrument that can be used when goods are purchased on credit.
C) is used to indicate that cargo was loaded onto a named vessel in good condition.
D) is used when the goods have been paid for in advance of shipment and requires delivery,and is a negotiable instrument that can be used when goods are purchased on credit.
E) is a negotiable instrument that can be used when goods are purchased on credit and is used to indicate that cargo was loaded onto a named vessel in good condition.
On Jun 20, 2024
A
CP
Answered
Which of the following presents a competency-based approach to leadership?
A) trait approach
B) skills approach
C) style approach
D) great person approach
A) trait approach
B) skills approach
C) style approach
D) great person approach
On May 24, 2024
B
CP
Answered
When a monopolistically competitive firm is in long-run equilibrium,
A) P = MC = ATC.
B) MR = MC and minimum ATC > P.
C) MR > MC and P = minimum ATC.
D) MR = MC and P> minimum ATC.
A) P = MC = ATC.
B) MR = MC and minimum ATC > P.
C) MR > MC and P = minimum ATC.
D) MR = MC and P> minimum ATC.
On May 21, 2024
D