Asked by Toronto Raptor on Jun 04, 2024

Verified
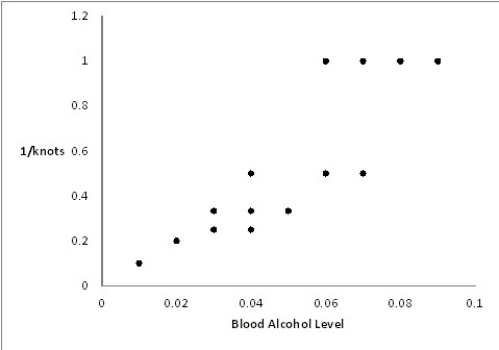
A psychology graduate student is studying the effect of alcohol intoxication on a person's ability to perform manual tasks.In a very simple experiment,a subject's blood alcohol level is brought to a certain level and then the subject is presented with 10 rope knots.The subject then attempts to untie as many knots as he or she can in 30 seconds.The results of the experiments are summarized in the table below. Blood No. of Blood No. of Alcohol Knots Alcohol Knots Level Untied Level Untied 0.0340.0530.0610.0250.0620.01100.01100.0710.0420.0910.0430.0910.0810.0330.0620.0720.0440.053\begin{array}{|l|l|l|l|}\hline\text { Blood } & \text { No. of } & \text { Blood } & \text { No. of } \\\text { Alcohol } & \text { Knots } & \text { Alcohol } & \text { Knots } \\\text { Level } & \text { Untied } & \text { Level } & \text { Untied } \\\hline 0.03 & 4 & 0.05 & 3 \\\hline 0.06 & 1 & 0.02 & 5 \\\hline 0.06 & 2 & 0.01 & 10 \\\hline 0.01 & 10 & 0.07 & 1 \\\hline 0.04 & 2 & 0.09 & 1 \\\hline 0.04 & 3 & 0.09 & 1 \\\hline 0.08 & 1 & 0.03 & 3 \\\hline 0.06 & 2 & 0.07 & 2 \\\hline 0.04 & 4 & 0.05 & 3 \\\hline\end{array} Blood Alcohol Level 0.030.060.060.010.040.040.080.060.04 No. of Knots Untied 4121023124 Blood Alcohol Level 0.050.020.010.070.090.090.030.070.05 No. of Knots Untied 3510111323 Re-express the number of knots untied by taking the inverse of each count,then plot the re-expressed data as a scatterplot. 
Blood Alcohol Level
The concentration of alcohol in one's bloodstream, used to determine intoxication level for legal and medical purposes.
Rope Knots
Configurations of rope designed to secure or fasten it, often used for functionality or decorative purposes.
Scatterplot
A statistical graph that represents the values of two variables for a given data set, illustrating their interrelation.
- Understand the idea of data re-expression to improve insight into the association between variables.
- Analyze data involving human performance or behavior under different conditions.

Verified Answer

Learning Objectives
- Understand the idea of data re-expression to improve insight into the association between variables.
- Analyze data involving human performance or behavior under different conditions.
Related questions
A University Radio Station Has Been Airing a Public Service ...
The Consumer Price Index (CPI)is a Measure of the Relative ...
Doctors Studying How the Human Body Assimilates Medication Inject Some \(= ...
A Forester Would Like to Know How Big a Maple ...
A Forester Would Like to Know How Big a Maple \(= ...