Asked by Katelyn McKay on Apr 24, 2024

Verified
Doctors studying how the human body assimilates medication inject some patients with penicillin,and then monitor the concentration of the drug (in units/cc)in the patients' blood for seven hours.First they tried to fit a linear model.The regression analysis and residuals plot are shown.Is that estimate likely to be accurate,too low,or too high? Explain. Dependent variable is: Concentration
No Selector
R squared =90.8%= 90.8 \% \quad=90.8% R squared (adjusted) =90.6%= 90.6 \%=90.6%
s=3.472s = 3.472s=3.472 with 43−2=4143 - 2 = 4143−2=41 degrees of freedom
Source Sum of Squares df Mean Square F-ratio Regression 4900.5514900.55407 Residual 494.1994112.0536\begin{array} { l l r r r } \text { Source } & \text { Sum of Squares } & \text { df } & \text { Mean Square } & \text { F-ratio } \\ \text { Regression } & 4900.55 & 1 & 4900.55 & 407 \\ \text { Residual } & 494.199 & 41 & 12.0536 & \end{array} Source Regression Residual Sum of Squares 4900.55494.199 df 141 Mean Square 4900.5512.0536 F-ratio 407
Variable Coefficient s.e. of Coeff t-ratio prob Constant 40.32661.29531.1 S 0.0001 Time −5.959560.2956−20.2 S 0.0001\begin{array} { l l l r l } \text { Variable } & \text { Coefficient } & \text { s.e. of Coeff } & \text { t-ratio } & \text { prob } \\ \text { Constant } & 40.3266 & 1.295 & 31.1 & \text { S } 0.0001 \\ \text { Time } & - 5.95956 & 0.2956 & - 20.2 & \text { S } 0.0001 \end{array} Variable Constant Time Coefficient 40.3266−5.95956 s.e. of Coeff 1.2950.2956 t-ratio 31.1−20.2 prob S 0.0001 S 0.0001 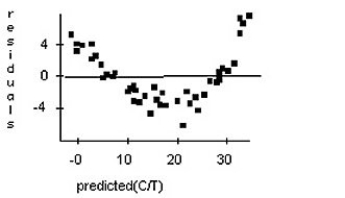
Linear Model
A statistical model that assumes a linear relationship between the input variables (predictors) and the single output variable.
Regression Analysis
A statistical method used to model the relationship between a dependent variable and one or more independent variables.
Residuals Plot
A graphical representation of the residuals (the differences between observed and predicted values) in a regression analysis, used to assess the fit of a model.
- Determine the adequacy of linear regression models through analysis of residual patterns and R-squared values.
- Comprehend the idea of re-expression within the framework of linear regression and its practical uses.

Verified Answer
SM
Saloni Manandhar8 days ago
Final Answer :
Too high; the residuals are generally negative for times between 2 and 5 hours.

Learning Objectives
- Determine the adequacy of linear regression models through analysis of residual patterns and R-squared values.
- Comprehend the idea of re-expression within the framework of linear regression and its practical uses.