Asked by Stephanie Schiwietz on Apr 29, 2024

Verified
Graph the equation y=2−xy = 2 - xy=2−x .
A) 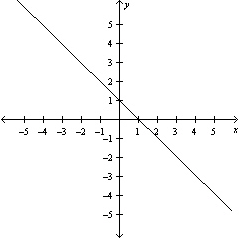
B) 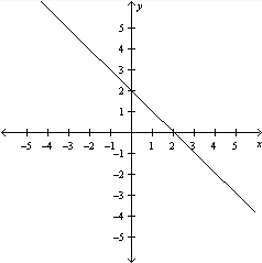
C) 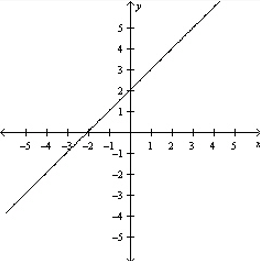
D) 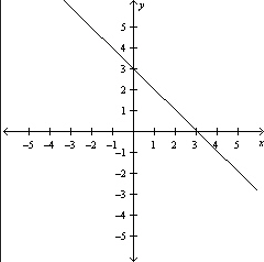
E) 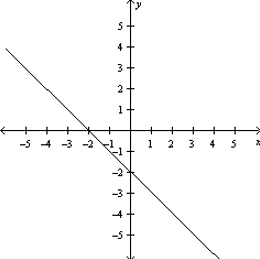
Graph
A visual representation of data or mathematical functions typically displayed using lines, bars, or points on a coordinate system.
Equation
A mathematical proposition that claims equality between two expressions, generally involving variables.
- Sketch linear equations on a graph and recognize aspects like steepness and points of intersection with axes.

Verified Answer
ZK
Zybrea KnightMay 05, 2024
Final Answer :
B
Explanation :
To graph the equation, we can start by plotting the y-intercept, which is 2. Then, using the slope of -1 (since the coefficient of x is -1), we can move down 1 unit and to the right 1 unit to find another point on the line. Plotting this second point and drawing a straight line through the two points gives us the graph of y = 2 - x, which is choice B.

Learning Objectives
- Sketch linear equations on a graph and recognize aspects like steepness and points of intersection with axes.
Related questions
Graph the Equations to Determine Whether the System Has Any \[\left\{ ...
Graph the Equations to Determine Whether the System Has Any \[\left\{ ...
Solve the Following Set of Equations Graphically ...
Solve the Following Set of Equations Graphically ...
Solve the Following Set of Equations Graphically ...