Asked by Neisha Bethly on Jun 19, 2024

Verified
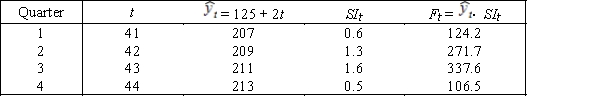
The trend line  = 125 + 2t and seasonal indexes shown in the table below were computed from 10 years of quarterly data.Forecast the values for the next four quarters.
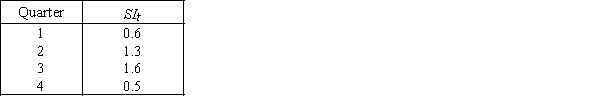
Seasonal Indexes
Numeric factors used to adjust data for seasonal variations, making trend analysis more accurate.
Quarterly Data
Data that is collected, reported, or compiled every three months within a year, often used in business and finance to track performance.
- Analyze the outcomes and predictions derived from fitting quadratic and linear models to time-series data.

Verified Answer
AC

Learning Objectives
- Analyze the outcomes and predictions derived from fitting quadratic and linear models to time-series data.