Asked by latoyria oliphant on Jun 19, 2024

Verified
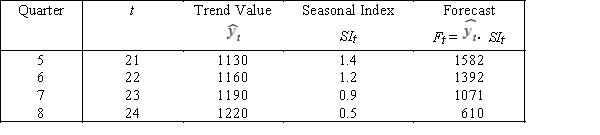
The trend line  = 500 + 30t,(t = 1,2,3,....,20),and the seasonal indexes shown in the table below were computed from five years of quarterly sales data.Forecast the sales for the next four quarters.
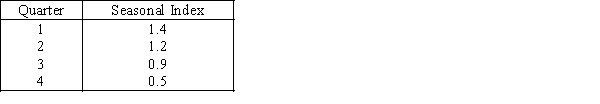
Seasonal Indexes
Numerical values used to adjust data for seasonal effects, allowing comparison across different times of a year by normalizing seasonal variations.
Quarterly Sales
The total income or revenue generated by sales activities in a quarter, often analyzed to assess financial health and performance trends in businesses.
- Assess the interpretations and prognostications following the application of quadratic and linear models to time-series data.

Verified Answer
LK

Learning Objectives
- Assess the interpretations and prognostications following the application of quadratic and linear models to time-series data.