Answers

BT

Answered

Graphical excellence is nearly always univariate.

On Sep 23, 2024


False
BT

Answered

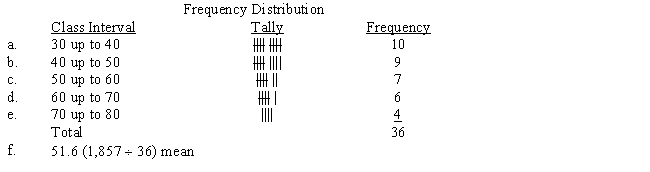
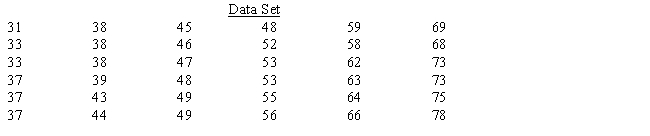
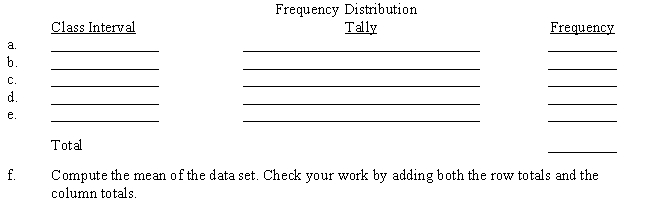
Construct a frequency distribution for the set of data below. Use five classes, beginning with "30 up to 40," then "40 up to 50," then "50 up to 60," then "60 up to 70," and finally "70 up to 80."
Construct a frequency distribution for the set of data below. Use five classes, beginning with 30 up to 40, then 40 up to 50, then 50 up to 60, then 60 up to 70, and finally 70 up to 80. ​    ​

On Sep 22, 2024