CF
Courtney Fraser
Answers (5)
CF
Answered
Independent random samples of n1 = 150 and n2 = 150 sales phone calls for an insurance policy were randomly selected from binomial populations 1 and 2, respectively. Sample 1 had 80 successful sales, and sample 2 had 88 successful sales. Suppose you have no preconceived theory concerning which parameter, p1 or p2, is the larger and you wish to detect only a difference between the two parameters if one exists.
Calculate the standard error of the difference in the two sample proportions, . Make sure to use the pooled estimate for the common value of p.
______________
Calculate the test statistic that you would use for the test above. Based on your knowledge of the standard normal distribution, is this a likely or unlikely observation, assuming that H0 is true and the two population proportions are the same?
Test statistic = ______________
Find the p-value for the test. Test for a significant difference in the population means at the 1% significance level.
p-value = ______________
Find the rejection region when = 0.01. Do the data provide sufficient evidence to indicate a difference in the population proportions?
Critical Value(s) = ______________
Conclusion: ______________
Interpretation: __________________________________________
Calculate the standard error of the difference in the two sample proportions,
. Make sure to use the pooled estimate for the common value of p.______________
Calculate the test statistic that you would use for the test above. Based on your knowledge of the standard normal distribution, is this a likely or unlikely observation, assuming that H0 is true and the two population proportions are the same?
Test statistic = ______________
Find the p-value for the test. Test for a significant difference in the population means at the 1% significance level.
p-value = ______________
Find the rejection region when
= 0.01. Do the data provide sufficient evidence to indicate a difference in the population proportions?Critical Value(s) = ______________
Conclusion: ______________
Interpretation: __________________________________________
On Jun 11, 2024
0.0573; -0.94; 0.3472; 2.575, -2.575; Do not reject H0; There is NO evidence of a difference in the two population proportions
CF
Answered
Determine the present value (accurate to the cent) of the ordinary general annuity:

On Jun 11, 2024
$38,367.94
CF
Answered
Match the graph with the graph of its inverse function. 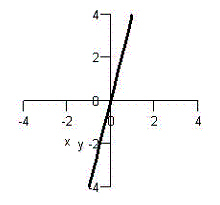
A)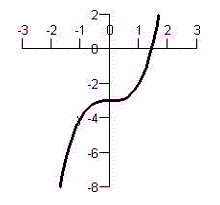
B)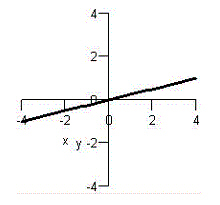
C)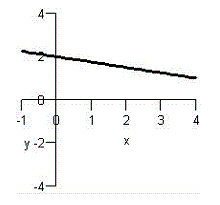
D)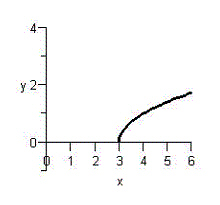
E)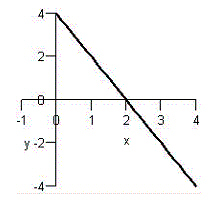
A)
B)
C)
D)
E)
On May 16, 2024
B
CF
Answered
Form the augmented matrix for the system of linear equations below. {6x+y+z=24x+4y+4z=98x+y+4z=−7\left\{ \begin{array} { r } 6 x + y + z = 2 \\4 x + 4 y + 4 z = 9 \\8 x + y + 4 z = - 7\end{array} \right.⎩⎨⎧6x+y+z=24x+4y+4z=98x+y+4z=−7
A) [29−7]\left[ \begin{array} { c } 2 \\9 \\- 7\end{array} \right]29−7
B) [648141144]\left[ \begin{array} { l l l } 6 & 4 & 8 \\1 & 4 & 1 \\1 & 4 & 4\end{array} \right]611444814
C) [61124449814−7]\left[ \begin{array} { c c c c } 6 & 1 & 1 & 2 \\4 & 4 & 4 & 9 \\8 & 1 & 4 & - 7\end{array} \right]64814114429−7
D) [611444814]\left[ \begin{array} { l l l } 6 & 1 & 1 \\4 & 4 & 4 \\8 & 1 & 4\end{array} \right]648141144
E) [64814114429−7]\left[ \begin{array} { c c c } 6 & 4 & 8 \\1 & 4 & 1 \\1 & 4 & 4 \\2 & 9 & - 7\end{array} \right]61124449814−7
On May 12, 2024
C
CF
Answered
If the CPI increases from 120.0 to 125.0 over a period, what is the percent increase in the CPI?
On May 08, 2024
4.17%